
Streamgraph
A dark streamgraph unrolls from 1955 to 2025 behind a sweeping year cursor: eight fictional radio genres in flat jewel colors swell and taper around a wandering center, each labeled inside its own band, before callouts mark Glasswave's 1990 peak and today's leader.
Written and rendered by AI CSS Animations Oct 18, 2026
- Type
- prompt
- Made with
- Claude Opus 5.5 in Claude Code
- Built in
- SVG
- Topics
- Charts
About this style
A streamgraph is a stacked area chart whose layers flow around a moving central baseline instead of resting on a flat axis, so the whole series reads as one organic shape. It grew out of ThemeRiver, a technique for showing topics over time published in 2000, and was refined in a 2008 paper on the geometry of stacked graphs that chose the baseline to minimize wiggle. That same year The New York Times used one to chart box-office takings. It suits data where many categories rise and fade over time, such as music listening, search interest or news coverage.
The prompt
Make a 10-second streamgraph: seventy years of fictional music genres flow left to right as one organic stream, its layers swelling and shrinking as each genre rises and fades.

<inputs>
If I don't give you something, use the default and don't ask.
- Station: Silverbank Radio (fictional).
- Title: "Seventy years on the dial"
- Dek: "Songs played each year on Silverbank Radio, by genre, in thousands."
- Plays in thousands, every five years from 1955 to 2025:
  Harbor Folk 6, 10, 14, 12, 8, 5, 4, 3, 3, 4, 5, 6, 7, 6, 5
  Ember Soul 4, 7, 11, 15, 16, 12, 9, 7, 6, 6, 7, 8, 7, 6, 6
  Flint Rock 0, 1, 4, 10, 18, 22, 20, 16, 14, 12, 9, 7, 6, 5, 5
  Spinlight 0, 0, 0, 1, 6, 16, 12, 6, 4, 5, 8, 9, 7, 8, 9
  Glasswave 0, 0, 0, 0, 1, 4, 14, 22, 14, 8, 6, 7, 9, 11, 10
  Block Verse 0, 0, 0, 0, 0, 0, 2, 6, 14, 20, 24, 22, 20, 19, 18
  Lamplight Pop 0, 0, 0, 0, 0, 0, 0, 1, 3, 6, 10, 14, 18, 22, 26
  Pulse Garage 0, 0, 0, 0, 0, 0, 0, 0, 2, 6, 10, 13, 16, 20, 24
  Totals: 10 in 1955, 61 in 1990, 103 in 2025.
- Callouts: "1990: Glasswave at its height, 22,000 plays" and "2025: Lamplight Pop leads with 26,000"
- Length: 10 seconds.
</inputs>

<direction>
- Palette: near-black ground #110E16 with a faint #1A1522 lift behind the stream. Genres, flat: Harbor Folk amber #E8B04E, Ember Soul rose #D9567A, Flint Rock vermilion #E8643A, Spinlight gold #F3D361, Glasswave violet #8D71E8, Block Verse teal #2DB6A3, Lamplight Pop lime #B7D65C, Pulse Garage cobalt #4079EC. Text #F4EEE8, secondary #A79DB0, decade lines #2A2433.
- Curves: interpolate each genre yearly with a monotone cubic (Fritsch–Carlson), so no layer dips below zero and genres taper to sharp points where they begin; sample every quarter year.
- Stacking, bottom to top (an inside-out order by first appearance): Lamplight Pop, Glasswave, Flint Rock, Harbor Folk, Ember Soul, Spinlight, Block Verse, Pulse Garage.
- Baseline: minimize wiggle. With layers f₁…fₙ bottom to top, step the baseline g from 1955 by Δg = −Σᵢ fᵢ·(Σₖ<ᵢ Δfₖ + Δfᵢ/2) ÷ Σᵢ fᵢ at each sample, then shift the whole stream so its midline averages y 600. If it would leave y 250–950, blend it 30% toward a symmetric baseline. Scale: 6.2px per thousand plays, so the 2025 stream is about 640px thick.
- Layers are flat fills separated by a 1.5px seam in the ground color, so the stream reads as ribbons.
- Plot: x 140 (1955) to x 1780 (2025). Decade lines at 1960 … 2020 from y 250 to 950, 1px, behind the stream; years in "Overpass Mono" 400, 20px, secondary, centered under them at y 1000.
- Labels: each genre's name sits inside its own layer where it fits best, preferring the thickest stretch: in "Syne" 700, sized min(34px, half the layer's local thickness), hidden below 20px, with at least 8px of layer around its box along its whole width and never past the plot's ends. Dark #110E16 on amber, gold, lime and teal; #FFF6EE on the others.
- Type: title in Syne 800, 72px, top-left at (120, 100); dek in Syne 500, 26px, secondary, beneath. Callouts in Syne 600, 24px, in clear ground above or below the stream on 1px #F4EEE8 leaders ending in a 5px dot at the layer's edge. A total at the right end above the stream, right-aligned at x 1780: "103,000 songs in 2025" in Overpass Mono 400, 22px.
- Reveal: a vertical year cursor sweeps from 1955 to 2025, the stream complete up to it and clipped hard at it; the cursor is a 1px #F4EEE8 line at 60% from y 250 to 950 with the current year above it in Overpass Mono 500, 24px. Each label fades in over 0.4 s once the cursor has passed its whole box.
- Motion is liquid and unhurried: the cursor moves on easeInOutSine; text rises 12px as it fades in over 0.5 s on cubic-bezier(0.22, 1, 0.36, 1); nothing bounces or snaps.
- Premium: one organic stream around a moving center, layers that taper to points, labels living inside their own bands, a few flat jewel colors on black. Cheap: a stacked area chart on a flat axis with a legend box, gradient fills and neon glow.
Banned: a flat zero baseline, a legend, gradients or glow in the layers, 3D, outlines in contrasting colors, kinked or negative layers, labels outside their layers, anything flashing more than 3 times per second.
</direction>

<structure>
- 0.0–1.0s: the dark ground; the decade lines draw down from the top, 60ms apart; year labels fade in; the title and dek rise in.
- 1.0–6.0s: the cursor sweeps 1955 → 2025 and the stream unrolls behind it: folk and soul first as a thin warm ribbon, rock swelling through the 1970s, Spinlight's bulge around 1980, Glasswave's violet surge around 1990, then Block Verse, Lamplight Pop and Pulse Garage widening the stream to the right; labels appear as the cursor clears them.
- 6.0–6.6s: the cursor and its year fade out; the last labels settle.
- 6.6–8.0s: the two callouts draw in turn, leader first, text rising after; the total sets at the right end.
- 8.0–10.0s: hold, completely still.
For other lengths, stretch the sweep; keep at least 1 s of hold.
</structure>

<build>
- One self-contained index.html (inline CSS and JS), a 1920×1080 (16:9) stage scaled to fit the window, designed for 60fps. No image, video, texture or model files: every shape and texture is generated in code.
- window.seek(t), t in seconds, computes every visual from t alone: no CSS transitions or CSS animations, no setTimeout/setInterval, no state carried between frames, randomness only from a seeded PRNG. Anything cumulative is solved analytically from t or precomputed once at load at a fixed step. Past the end, seek clamps to the last frame.
- Without ?render in the URL, drive seek from requestAnimationFrame so it plays in a browser (loop after a 1s end hold); with ?render, don't start that loop.
- Google Fonts via <link> are fine; await document.fonts.load() for each face before defining window.seek.
- Engine: inline SVG: one path per layer computed once at load, revealed by a clip rectangle whose width is set from t. No chart libraries.
- The interpolated series, baseline and label positions are computed once at load; seek(t) only moves the cursor, the clip and the opacities.
</build>

<check>
Before showing me, step through one frame per second (t = 0…10): screenshot each and look at it. Fix overlaps, clipped or cramped text, and anything off-style or Banned. Check every layer tapers smoothly with no kinks or dips below its neighbour, the stream stays between y 250 and 950, every label sits fully inside its own layer, the 2025 column adds up to 103 (about 640px thick), and the 6 s frame shows the whole stream from 1955 to 2025. Confirm seek(10) and seek(11) match, so the final frame holds.
</check>
Ours, and free to use under CC0: copy it, change it, ship it. No credit needed.
Similar prompts
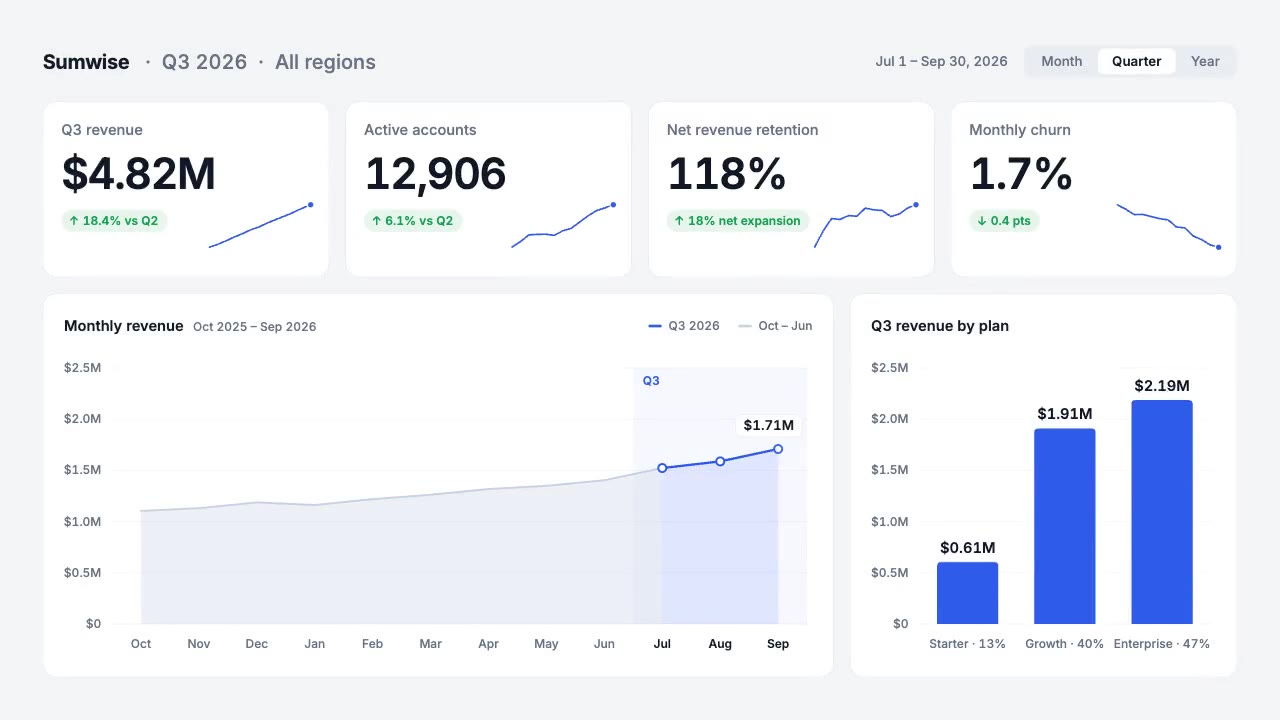
A light analytics dashboard builds itself from fictional data that adds up: counters roll on tabular figures, sparkline…
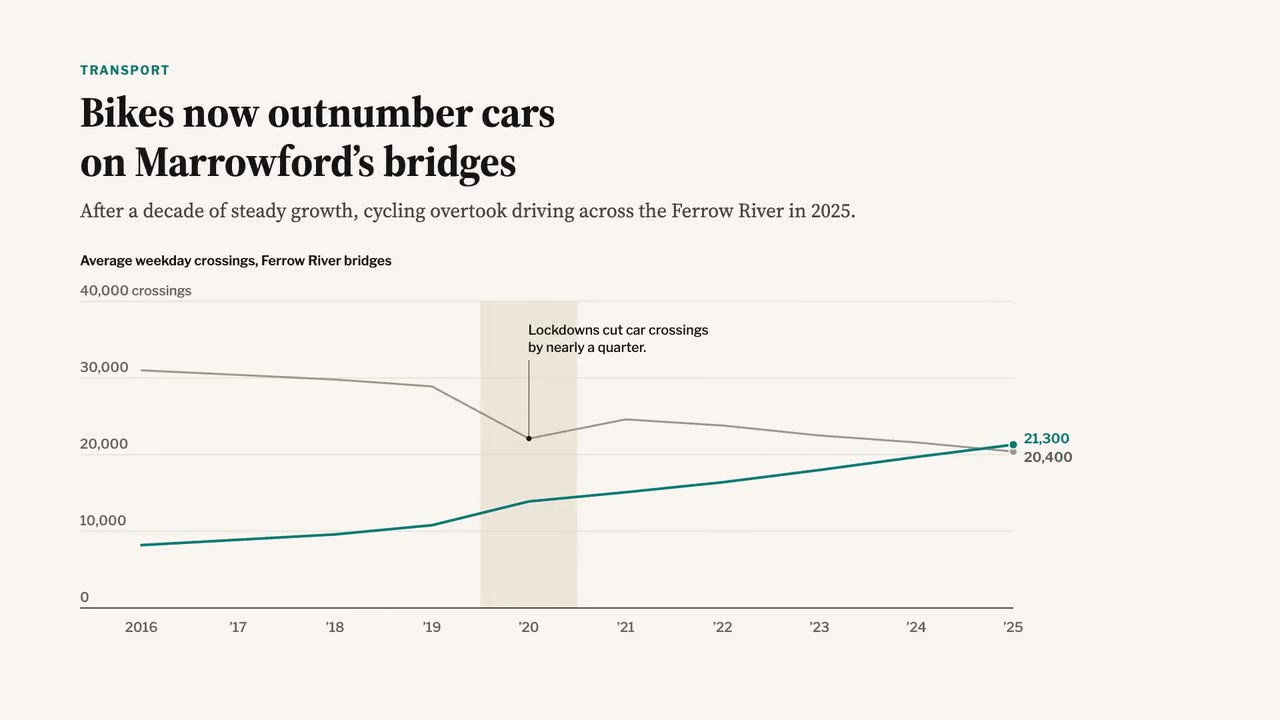
A newspaper-grade animated chart: serif headline and dek, a two-line chart that draws year by year, a shaded 2020 band,…
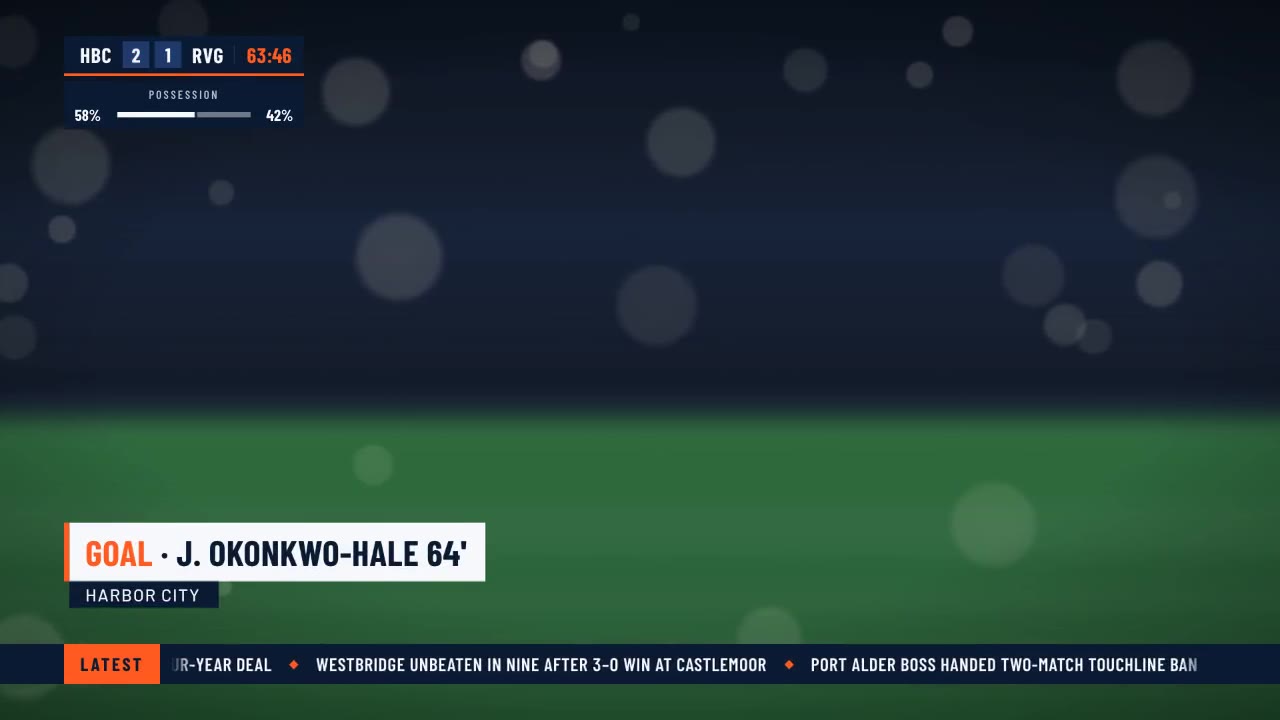
A crisp live-sports graphics package over a soft-focus stadium feed: score bug with running clock, layered lower third,…
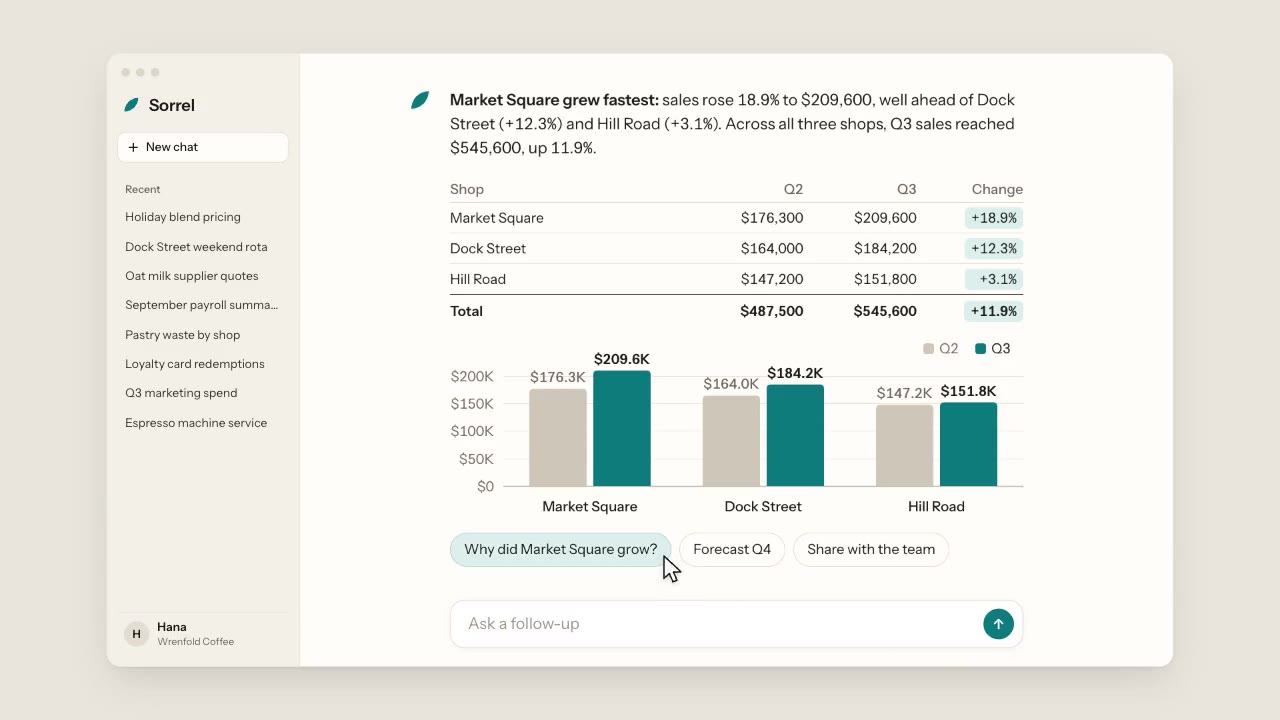
A warm, light chat app: a cursor types a question about three coffee shops, the assistant streams its answer word by wo…
More like this on the motion design inspiration board: Data visualization inspiration