
KPI Dashboard Reveal
A light analytics dashboard builds itself from fictional data that adds up: counters roll on tabular figures, sparklines and a revenue line draw, plan bars grow, and $4.82M lands as the hero metric.
Written and rendered by AI CSS Animations Oct 12, 2026
- Type
- prompt
- Made with
- Claude Opus 5.5 in Claude Code
- Built in
- SVG
- Topics
- Charts · Product UI
About this style
The dashboard reveal turns a static analytics screen into a short story: structure first, then numbers, then charts, then the one figure that matters. Done well, it respects the data: counters land on their true values, nothing overshoots, and every derived number matches its chart. Software and fintech companies use it in launch videos and product pages to make metrics feel both impressive and trustworthy.
The prompt
Make a 10-second dashboard reveal: counters roll, sparklines draw, bars grow and a big metric lands, from fictional data that adds up.

<inputs>
If I don't give you something, use the default and don't ask.
- Product: Sumwise (analytics), Q3 2026
- Monthly revenue, Oct 2025–Sep 2026, $k: 1104, 1131, 1187, 1162, 1219, 1262, 1318, 1349, 1404, 1523, 1588, 1709
- Q3 revenue by plan, $M: Starter 0.61, Growth 1.94, Enterprise 2.27
- Active accounts 12,906 (+6.1%); net revenue retention 118%; monthly churn 1.7% (down 0.4 points)
- Length: 10 seconds
</inputs>

<direction>
- Honesty: derive every number from the data. Q3 revenue is Jul–Sep summed ($4.82M) versus Apr–Jun (+18.4%); plan bars sum to the same total. Sparklines are 13 weekly points from a seeded random walk ending exactly on the shown value.
- Palette: canvas #F3F4F6; cards #FFFFFF, 1px #E4E7EC border, 20px radius; ink #101828; muted #667085; gridlines #EEF0F3; series #2F5BEA; earlier periods #C9D2E3; good #12A150 (including falling churn); bad #E5484D.
- Type: Inter with tabular figures ("tnum") so counters never shift. Labels 22px/500 muted; KPI values 64px/600, −0.03em; hero metric 220px.
- Layout: 64px margins, 24px gutters. Header: "Sumwise · Q3 2026 · All regions" plus a period control. Row 1: four KPI cards (label, value, delta chip, sparkline). Row 2: a monthly revenue line-and-area chart over 8 columns (Q3 in the series color, earlier months as context) and plan bars over 4.
- SVG charts: lines revealed by stroke-dashoffset, areas fading in after, bars scaling from the baseline; axis labels ≥18px.
- Motion: counters roll 1.2–1.6 s on cubic-bezier(0.16, 1, 0.3, 1), formatted with separators every frame; lines draw on cubic-bezier(0.65, 0, 0.35, 1); bars grow over 0.6 s, 60 ms apart. Data never overshoots; digits never spin like a slot machine.
- Premium is a dashboard a real team would trust: aligned baselines, quiet gridlines, one emphasis color.
Banned: 3D charts, pies or donuts, gradient bars, glow, lorem ipsum, emoji, real company names.
</direction>

<structure>
- 0.0–0.8: Hairline card outlines draw.
- 0.8–2.2: Cards fill and rise 8px, 80 ms apart.
- 2.2–3.8: Counters roll while sparklines draw; each delta chip fades in as its count lands.
- 3.8–5.6: Gridlines fade in; the revenue line draws in 1.4 s, the area follows; September gets a "$1.71M" label.
- 5.6–6.8: Plan bars grow, values counting in step.
- 6.8–8.2: Everything but the revenue card dims to 30%; its figure lifts into a centered hero, "$4.82M", over "Q3 revenue · +18.4% vs Q2".
- 8.2–10.0: Hold.
For other lengths, scale the beats; counters need at least 1 s and the final hold at least 1.5 s.
</structure>

<build>
- One self-contained index.html (inline CSS and JS) with a fixed 1920×1080 (16:9) stage scaled to fit the window; design for 60fps.
- window.seek(t), t in seconds, sets every visual from t alone: no CSS transitions or animations, no setTimeout/setInterval, no state carried between frames. Randomness comes from a seeded PRNG; springs are closed-form functions of time.
- Without ?render in the URL, drive seek from requestAnimationFrame so it plays in a browser; with ?render, don't start that loop.
- Google Fonts via <link> are fine. Draw everything as inline SVG whose attributes seek sets directly; no canvas or three.js needed.
</build>

<check>
Before showing me, screenshot seek(0) through seek(10), one frame per second, and look at each. Fix overlaps, clipped or cramped text, and anything generic. Recheck every number against the data; counter widths must not jitter, and labels must clear chart lines. Confirm the final frame holds.
</check>
Ours, and free to use under CC0: copy it, change it, ship it. No credit needed.
Similar prompts
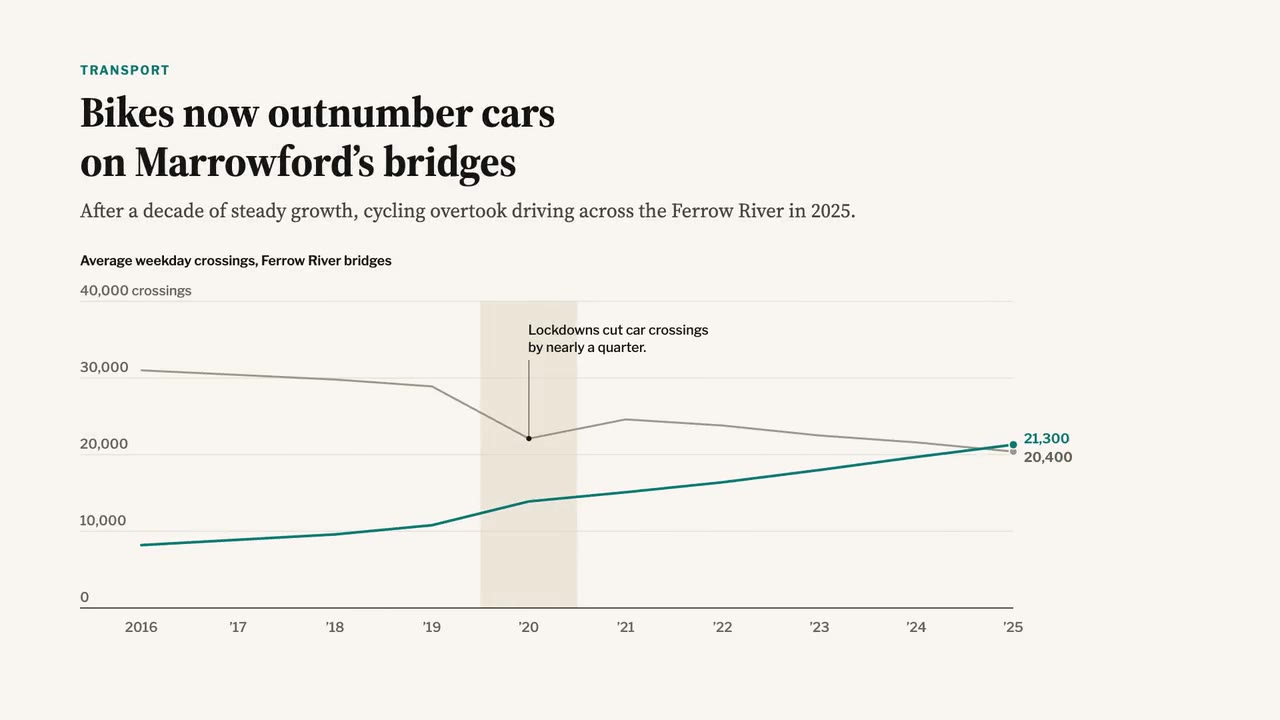
A newspaper-grade animated chart: serif headline and dek, a two-line chart that draws year by year, a shaded 2020 band,…
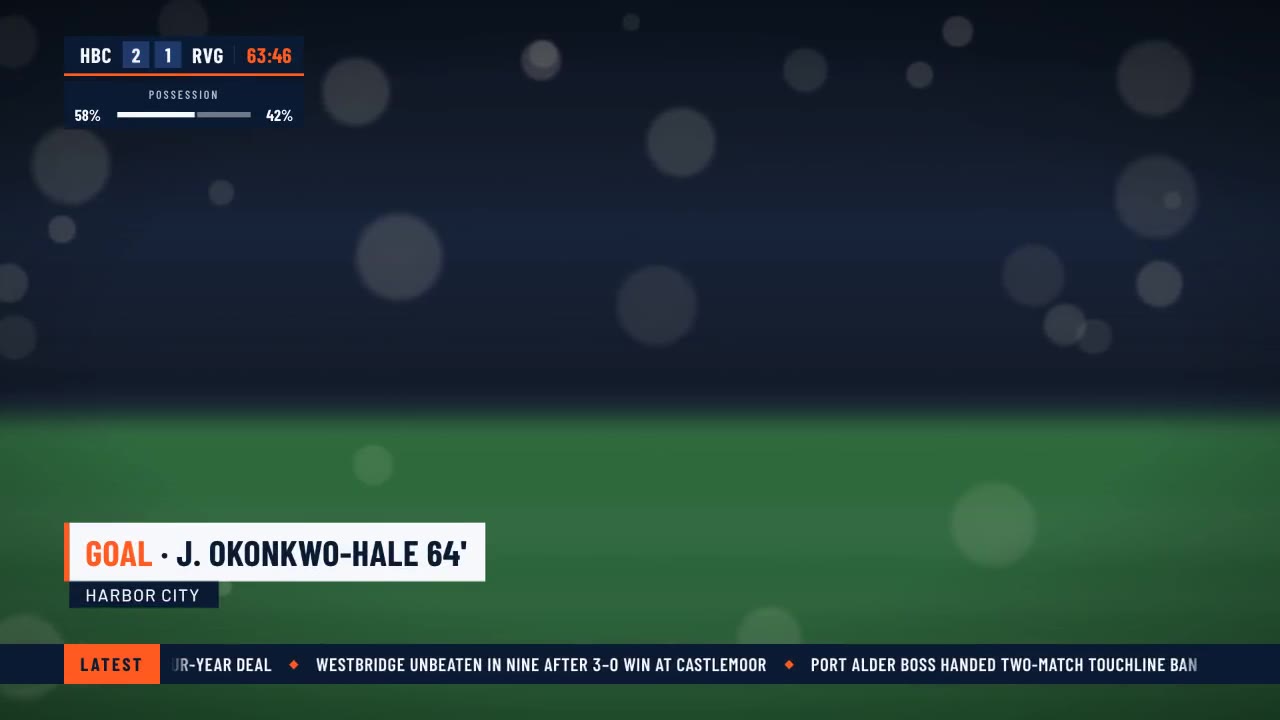
A crisp live-sports graphics package over a soft-focus stadium feed: score bug with running clock, layered lower third,…
The front door is /hyperframes. This skill makes a short, design-led, unnarrated motion graphic (motion is the message;…

<inputs> Ask me for: 8 to 12 UI states I want the shape to become (e.g. button, loader, player, slider, toggle, tabs, c…