
Radial Bar Chart
On deep pine green, 24 cream bars grow outward from a ring in alphabetical order, then glide around the circle into ranked order from 4,120 street trees down to 650, two-line labels riding with them, before the top three turn gold and the bottom three coral.
Written and rendered by AI CSS Animations Oct 18, 2026
- Type
- prompt
- Made with
- Claude Opus 5.5 in Claude Code
- Built in
- SVG
- Topics
- Charts
About this style
A radial bar chart lays its bars around a circle instead of along a straight baseline, each bar starting from an inner ring and growing outward. It is a cousin of the polar area diagram Florence Nightingale published in 1858 to show causes of death in the Crimean War, where each wedge's area carried the value. Sorted from longest to shortest, radial bars spiral around the ring and pack many categories into a compact, striking shape. Designers use them in annual reports, infographics and social posts where impact matters as much as precise comparison.
The prompt
Make a 10-second radial bar chart: 24 bars grow outward from a ring, then re-rank themselves around the circle from largest to smallest, their labels following.

<inputs>
If I don't give you something, use the default and don't ask.
- City: Mossford (fictional).
- Kicker: "MOSSFORD CANOPY COUNT"
- Title: "Street trees by district"
- Dek: "Every tree on a public street, counted in spring 2026."
- Districts and trees (24 districts, 49,000 trees): Oakfield 4,120 · Linden Rise 3,860 · Coppice Hill 3,540 · Fallowmead 3,310 · Bellamy Park 3,080 · Ashcombe 2,870 · Starling Row 2,690 · Millbrook 2,520 · Heron Common 2,360 · Thistle Fields 2,210 · Pennyfield 2,060 · Bracken Hill 1,930 · Orchard Gate 1,800 · Tolley 1,680 · Redmarsh 1,560 · Swan Lane 1,450 · Plover Heath 1,340 · Brookside 1,240 · Dovecote 1,140 · Ivy Court 1,040 · Ropewalk 940 · Ironworks 850 · Docklands 760 · Quarry End 650.
- Callout: "Oakfield has more than six times the street trees of Quarry End."
- Source: "Mossford Parks Department street tree survey, spring 2026."
- Length: 10 seconds.
</inputs>

<direction>
- Palette: pine ground #0F3A2E with a soft radial lift to #14463A behind the chart; scale rings #2C5C4B at 1px; bars cream #ECE3CB; the top three gold #F2C14E and the bottom three coral #E9906F once ranked; text cream #F1EAD6, secondary #A9C2B5.
- Geometry: the chart is centered at (1200, 540). Bars are annular sectors 9.5° wide on a 13° pitch with 3px rounded outer corners, from the inner ring at r 100 to r = 100 + 200 × trees ÷ 4,200, so Oakfield reaches r 296 and Quarry End r 131. The 24 slots fill 312° and leave a 48° gap centered on 12 o'clock: slot k is centered 30.5° + 13°·k clockwise from 12 o'clock. Rank 1 takes slot 0, just clockwise of the gap, so the ranked bars spiral down clockwise.
- Scale: circles at 1,000, 2,000, 3,000 and 4,000 trees, their values in "Sora" 400, 20px, secondary, stacked up the gap along the 12 o'clock radius.
- Labels: two lines set along each bar's direction from r 312 outward: the district in Sora 600, 20px, cream, and the count in Sora 400, 20px, at 70%. On the right half they read outward; on the left half they're turned 180° so they still read left to right, right-aligned at r 312. No label may be upside down or touch a neighbour.
- Center: "49,000" in "Gloock" 400, 40px, cream, over "street trees" in Sora 400, 20px, secondary, inside the inner ring.
- Text column at x 120–600: the kicker in Sora 600, 20px, tracked 0.16em, gold, at y 140; the title in Gloock 400, 72px, cream, two lines; the dek in Sora 400, 26px, secondary; later the callout in Gloock 400, 34px, cream, with "4,120 vs 650" under it in Sora 600, 24px, gold; the source at y 990 in Sora 400, 20px, secondary.
- Re-ranking: each bar travels around the ring along the circle to its ranked slot, keeping its length, the short way round but never through the gap, each move 0.9 s on cubic-bezier(0.65, 0, 0.35, 1), staggered 30ms by rank. Moving bars draw at 85% so crossings read. Labels ride with their bars; a label crossing 6 o'clock crossfades between its two orientations over 0.2 s.
- Motion: bars grow outward from the inner ring over 0.6 s on easeOutCubic; each label slides 10px outward along its radius and fades in as its bar arrives; text rises 12px as it fades in over 0.5 s on cubic-bezier(0.22, 1, 0.36, 1); colors change over 0.4 s. Nothing bounces.
- Premium: a ranked spiral that reads at a glance, one true length scale from the inner ring, labels that stay readable and follow their bars, a calm two-accent palette. Cheap: a rainbow donut, bars starting from the center point, labels upside down.
Banned: bars drawn from the center point, values shown by area or color alone, gradients, 3D, glow, rainbow colors, upside-down labels, overlapping labels, a legend, more than two accent colors, anything flashing more than 3 times per second.
</direction>

<structure>
- 0.0–0.8s: the pine ground; the scale rings draw clockwise from the gap, 60ms apart, and their values fade in.
- 0.6–1.4s: the kicker, title and dek rise in, 0.15 s apart; the center total fades up.
- 1.4–3.4s: the bars grow in alphabetical order, clockwise from slot 0, 60ms apart, each label arriving with its bar: an unsorted, jagged crown.
- 3.4–3.8s: stillness.
- 3.8–5.4s: the re-rank: every bar glides around the ring to its ranked slot, labels following, until the bars spiral down clockwise from Oakfield to Quarry End.
- 5.4–5.9s: the top three turn gold and the bottom three coral.
- 5.9–7.2s: the callout and its figures rise in under the dek; 1px cream leaders draw from the text to the ends of the Oakfield and Quarry End bars.
- 7.2–8.0s: the source fades in.
- 8.0–10.0s: hold, completely still.
For other lengths, stretch the re-rank; keep at least 1 s of hold.
</structure>

<build>
- One self-contained index.html (inline CSS and JS), a 1920×1080 (16:9) stage scaled to fit the window, designed for 60fps. No image, video, texture or model files: every shape and texture is generated in code.
- window.seek(t), t in seconds, computes every visual from t alone: no CSS transitions or CSS animations, no setTimeout/setInterval, no state carried between frames, randomness only from a seeded PRNG. Anything cumulative is solved analytically from t or precomputed once at load at a fixed step. Past the end, seek clamps to the last frame.
- Without ?render in the URL, drive seek from requestAnimationFrame so it plays in a browser (loop after a 1s end hold); with ?render, don't start that loop.
- Google Fonts via <link> are fine; await document.fonts.load() for each face before defining window.seek.
- Engine: inline SVG, setting paths, transforms and opacity from seek. No chart libraries.
- Each bar's angle during the re-rank is a closed-form function of t from its alphabetical slot to its ranked slot.
</build>

<check>
Before showing me, step through one frame per second (t = 0…10): screenshot each and look at it. Fix overlaps, clipped or cramped text, and anything off-style or Banned. Check every bar length matches r = 100 + 200 × trees ÷ 4,200, the ranked order runs clockwise from Oakfield to Quarry End, no label is upside down, overlapping or crossing another bar, the gap stays empty except for the scale values, and the 6 s frame shows the finished ranked ring. Confirm seek(10) and seek(11) match, so the final frame holds.
</check>
Ours, and free to use under CC0: copy it, change it, ship it. No credit needed.
Similar prompts
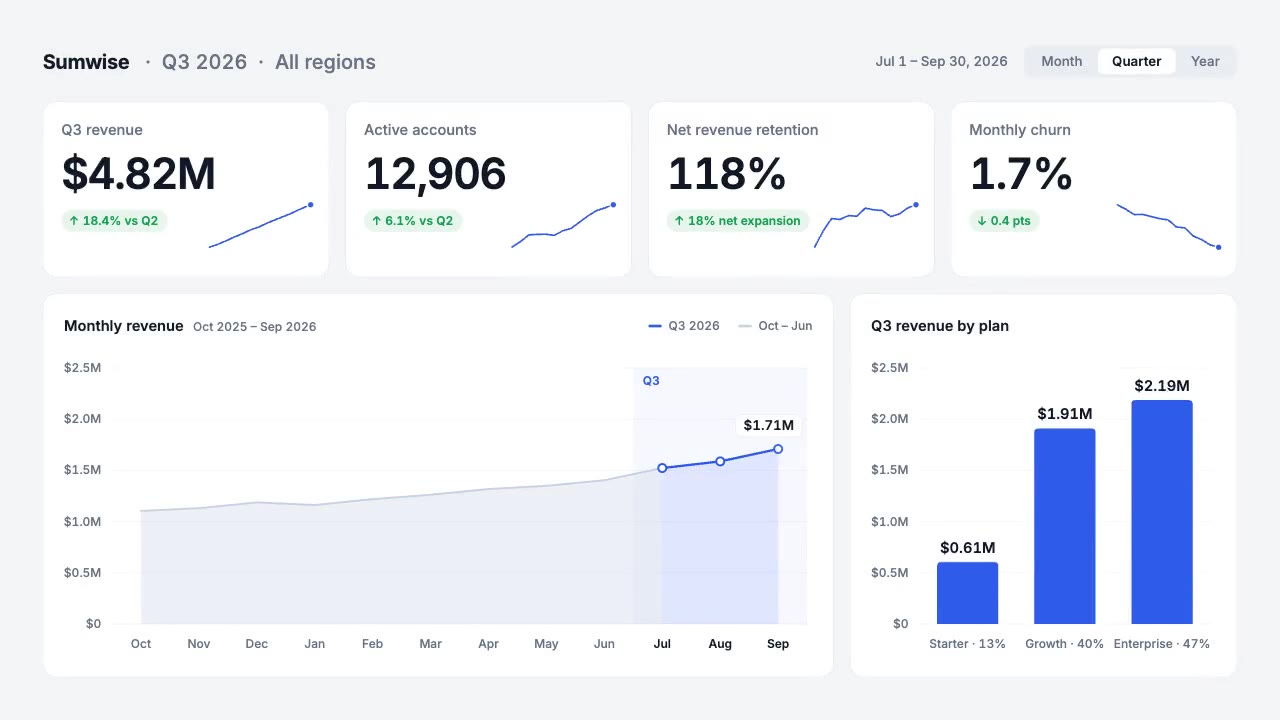
A light analytics dashboard builds itself from fictional data that adds up: counters roll on tabular figures, sparkline…
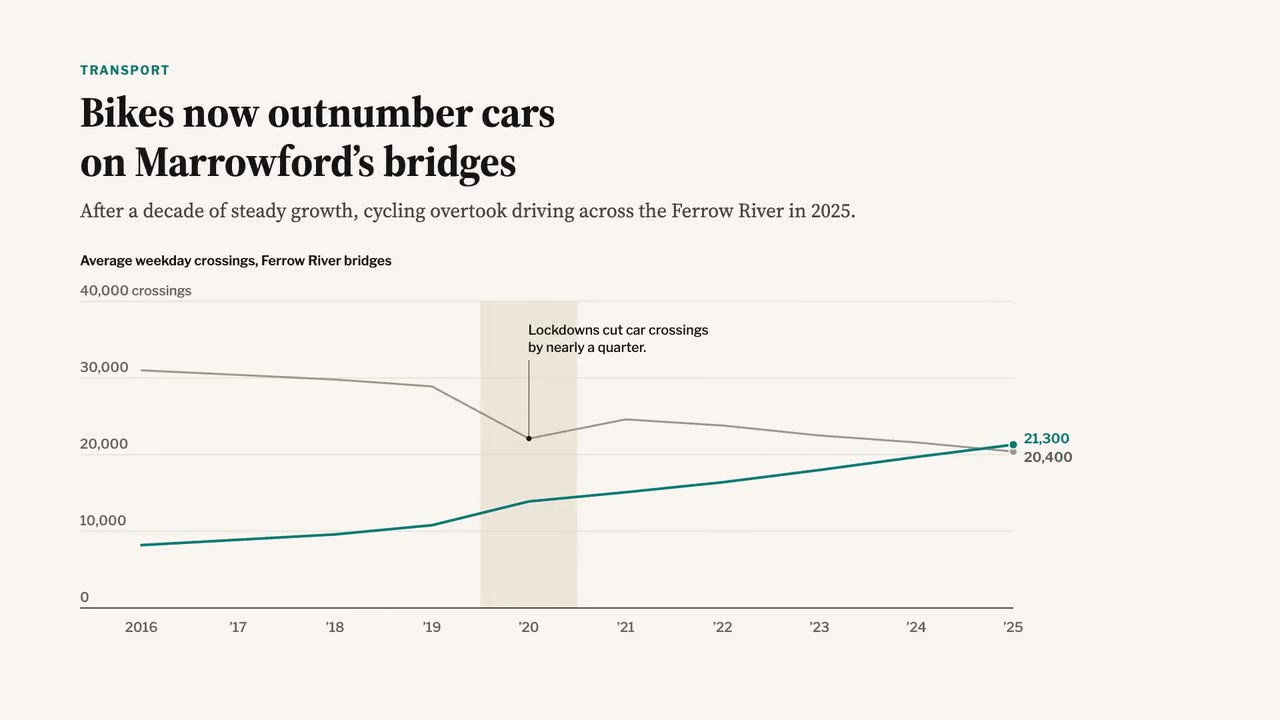
A newspaper-grade animated chart: serif headline and dek, a two-line chart that draws year by year, a shaded 2020 band,…
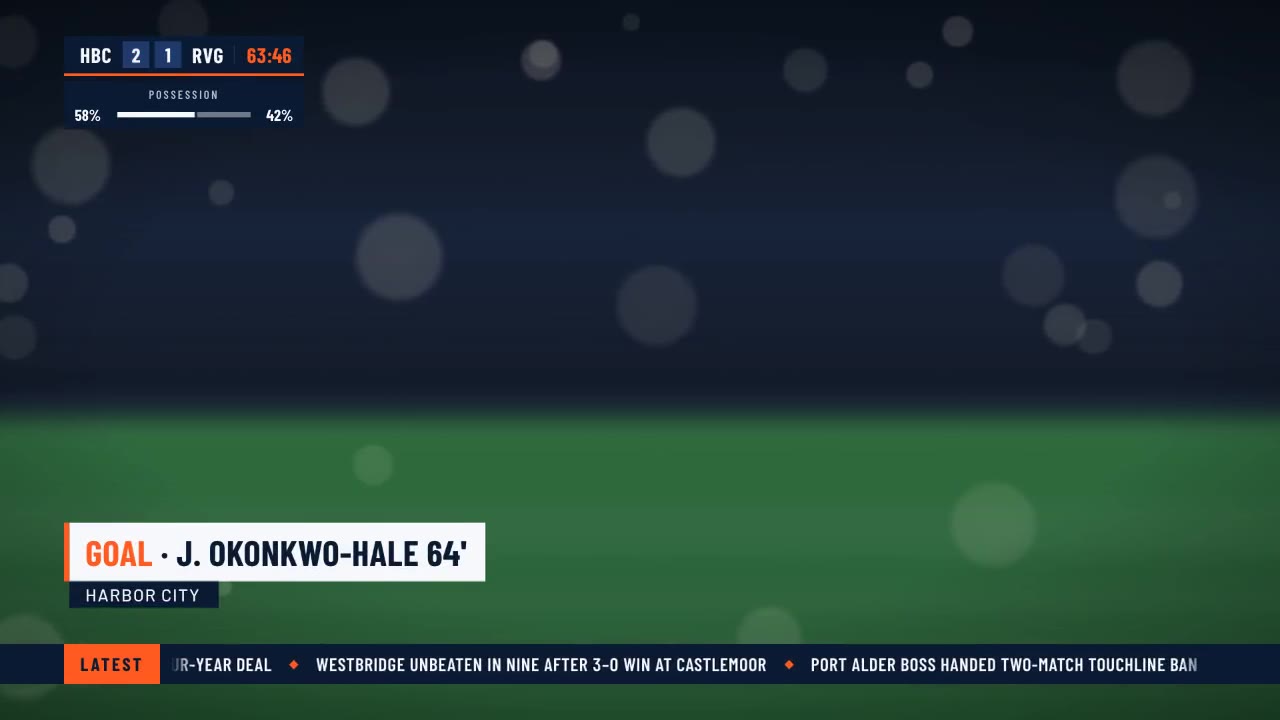
A crisp live-sports graphics package over a soft-focus stadium feed: score bug with running clock, layered lower third,…
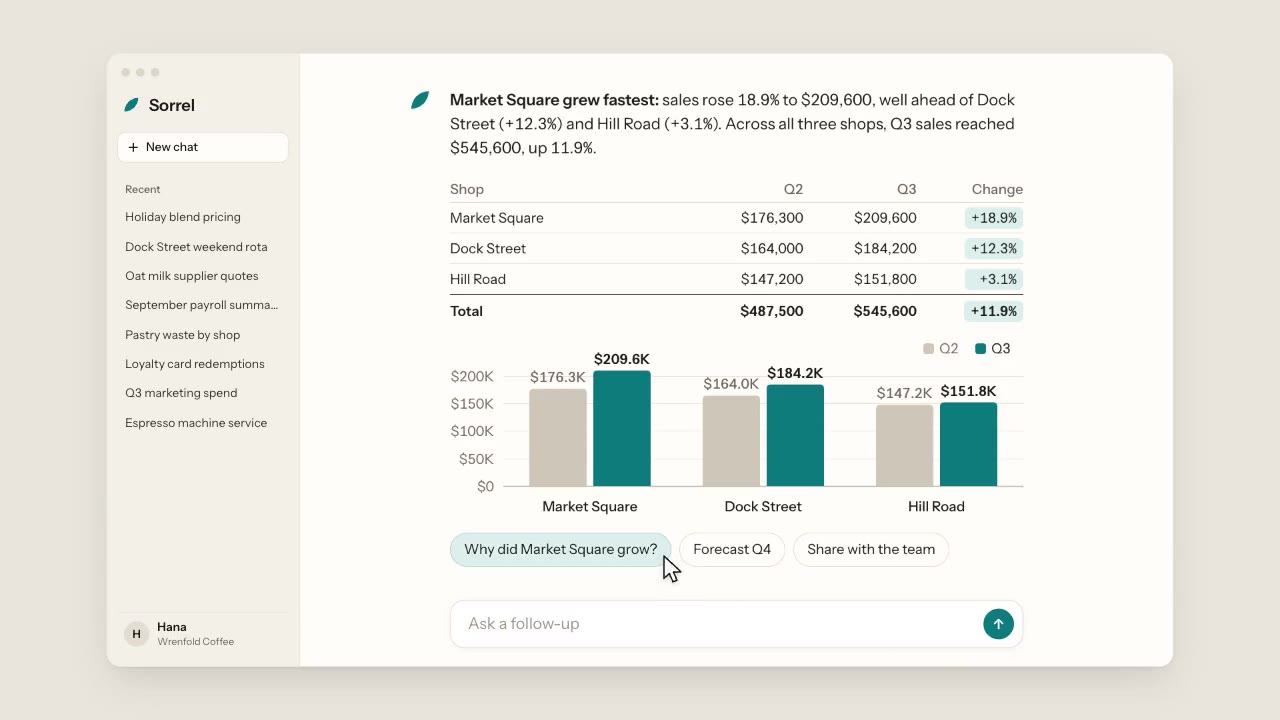
A warm, light chat app: a cursor types a question about three coffee shops, the assistant streams its answer word by wo…
More like this on the motion design inspiration board: Data visualization inspiration