
Slope Chart
On a mustard poster, eight library sections drop onto 2016 and 2026 axes and straight lines draw across, crossing as they go, then the risers turn bold ink and the fallers oxblood, with change tags, rank callouts and a totals line.
Written and rendered by AI CSS Animations Oct 18, 2026
- Type
- prompt
- Made with
- Claude Opus 5.5 in Claude Code
- Built in
- SVG
- Topics
- Charts
About this style
A slope chart compares a set of items at two points in time by joining each item's two values with a straight line on a shared scale, so the slope shows the change and crossing lines show changes in rank. Edward Tufte introduced the form, which he called a slopegraph, in his 1983 book The Visual Display of Quantitative Information. Direct labels at both ends replace a legend, and color is usually kept for the few lines that carry the story. Newsrooms and analysts use it for before-and-after comparisons of rankings, prices or survey results.
The prompt
Make a 10-second slope chart: eight library sections compared in 2016 and 2026, straight lines crossing to show which rose and which fell.

<inputs>
If I don't give you something, use the default and don't ask.
- Library: Quillmoor Public Library (fictional).
- Kicker: "QUILLMOOR LIBRARY"
- Headline: "Fewer loans, new favorites"
- Dek: "Yearly loans by section, in thousands. Graphic novels and audiobooks more than tripled while films on disc nearly vanished."
- Loans in thousands, 2016 → 2026: Fiction 48 → 41 · Children's 39 → 44 · Films on disc 26 → 3 · Reference 21 → 5 · Travel guides 18 → 7 · Cookery 14 → 16 · Graphic novels 8 → 27 · Audiobooks 6 → 23. Totals 180 → 166.
- Callouts: "Graphic novels: 7th to 3rd" and "Films on disc: 3rd to last"
- Totals line: "All loans: 180,000 → 166,000 (−8%)"
- Source: "Quillmoor Public Library loan records, 2016 and 2026."
- Length: 10 seconds.
</inputs>

<direction>
- Palette, a printed poster: mustard ground #E8B23A with a static seeded paper grain at 3%; ink #1B1712, secondary #5B4823; neutral lines ink at 24%, risers solid ink, fallers oxblood #9E2419.
- Layout: a text column at x 120–560; two axes at x 860 (2016) and x 1400 (2026) on one shared linear scale, 0 at y 960 to 50 at y 260 (14px per thousand). Axes are 2px ink rules from y 260 to 960 with short ticks at 0, 10, 20, 30, 40 and 50 on their outer sides, values in "Chivo Mono" 400, 20px, secondary. Column heads "2016" and "2026" in "Anybody" 800 (width 75), 64px, centered over each axis on baseline y 220.
- Text column: the kicker in Chivo Mono 500, 20px, tracked 0.14em, oxblood, at y 150; the headline in Anybody 800 (width 75), 76px, leading 0.95, two lines; the dek in Anybody 500 (width 90), 26px, secondary, 440px wide; a key: a short ink stroke "rose by more than half", an oxblood stroke "fell by more than half", a faint stroke "changed less", at 22px; then the two callouts, each led by a 24px stroke in its line's color, in Anybody 700 (width 90), 26px; the totals line in Chivo Mono 500, 24px; the source at y 990 in Anybody 400, 20px, secondary.
- Lines: straight segments between each section's two values, never curved. Endpoints are 12px dots in the line's color with a 3px ground-colored ring. Risers (Graphic novels, Audiobooks) are 5px ink; fallers (Films on disc, Reference, Travel guides) 5px oxblood; the rest (Fiction, Children's, Cookery) 3px ink at 24%. Neutral lines draw first, fallers next, risers on top.
- Labels: left labels right-aligned ending at x 836, the name in Anybody 600 (width 90), 24px, then the value in Chivo Mono 500, 24px ("Fiction  48"); right labels start at x 1424 ("41  Fiction"). Labels sit at their values but are nudged apart to at least 30px without moving the dots (Graphic novels and Audiobooks on the left; Travel guides, Reference and Films on disc on the right), with a short 1px leader where one moved. After the right labels of the five colored lines, change tags in Chivo Mono 600, 22px, in the line's color: +238%, +283%, −88%, −76%, −61%.
- Motion is editorial and firm: dots drop 20px into place over 0.3 s on cubic-bezier(0.2, 0.8, 0.2, 1); lines draw left to right by dash offset over 1.4 s on cubic-bezier(0.65, 0, 0.35, 1); color and weight changes ease over 0.4 s; text rises 14px as it fades in over 0.45 s on cubic-bezier(0.22, 1, 0.36, 1). Nothing bounces.
- Premium: two clear axes on one scale, direct labels nudged apart, color only where the story is, lines you can follow end to end. Cheap: a legend, eight rainbow lines, a grouped bar chart pretending to be a slope.
Banned: legends, rainbow line colors, curved or smoothed lines, two different scales, gridlines across the middle, 3D, glow, drop shadows, overlapping labels, anything flashing more than 3 times per second.
</direction>

<structure>
- 0.0–1.0s: the mustard ground; the kicker, headline and dek rise in, 0.15 s apart.
- 1.0–1.6s: the two axes draw up from 0; ticks and values fade in; the column heads rise.
- 1.6–2.6s: the eight 2016 dots drop onto the left axis, top to bottom, 70ms apart, each label setting as it lands.
- 2.6–4.2s: all eight lines draw across to 2026 together, crossing as they go; each 2026 dot drops and its label sets as its line arrives.
- 4.2–5.0s: the reveal: neutral lines fade to 24%, fallers turn oxblood, risers thicken; the key rises in; the change tags set.
- 5.0–5.9s: the callouts, then the totals line, rise in below the key.
- 6.6–7.4s: the source fades in.
- 7.4–10.0s: hold, completely still.
For other lengths, stretch the line draw; keep at least 1 s of hold.
</structure>

<build>
- One self-contained index.html (inline CSS and JS), a 1920×1080 (16:9) stage scaled to fit the window, designed for 60fps. No image, video, texture or model files: every shape and texture is generated in code.
- window.seek(t), t in seconds, computes every visual from t alone: no CSS transitions or CSS animations, no setTimeout/setInterval, no state carried between frames, randomness only from a seeded PRNG. Anything cumulative is solved analytically from t or precomputed once at load at a fixed step. Past the end, seek clamps to the last frame.
- Without ?render in the URL, drive seek from requestAnimationFrame so it plays in a browser (loop after a 1s end hold); with ?render, don't start that loop.
- Google Fonts via <link> are fine; await document.fonts.load() for each face before defining window.seek.
- Engine: inline SVG with hand-computed scales, setting attributes, dash offsets and opacity from seek. No chart libraries. Request the Anybody width axis in the Google Fonts URL.
- Label positions and nudges are computed once at load; every animated value is a closed-form function of t.
</build>

<check>
Before showing me, step through one frame per second (t = 0…10): screenshot each and look at it. Fix overlaps, clipped or cramped text, and anything off-style or Banned. Check every dot sits exactly at its value on the shared scale, lines are straight, labels are nudged apart without overlapping and their leaders point at the right dots, the change tags match the data, the colors appear only on the five highlighted lines, and the 6 s frame is the complete story. Confirm seek(10) and seek(11) match, so the final frame holds.
</check>
Ours, and free to use under CC0: copy it, change it, ship it. No credit needed.
Similar prompts
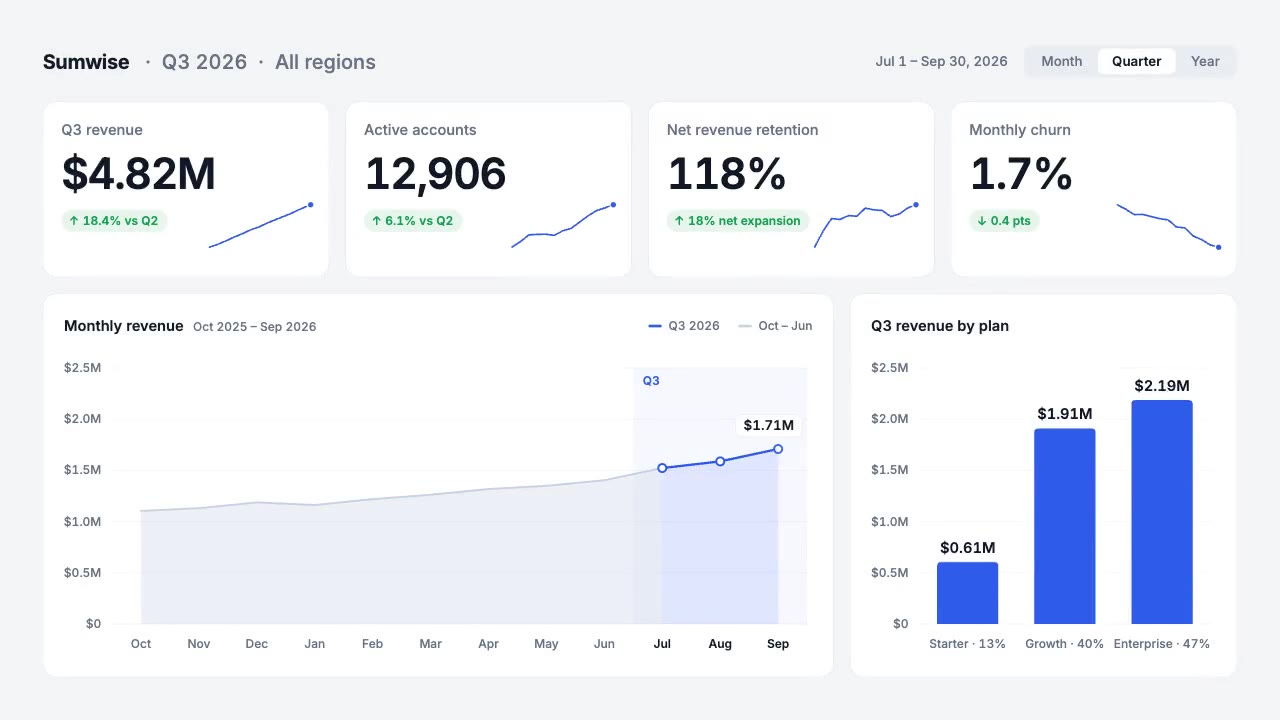
A light analytics dashboard builds itself from fictional data that adds up: counters roll on tabular figures, sparkline…
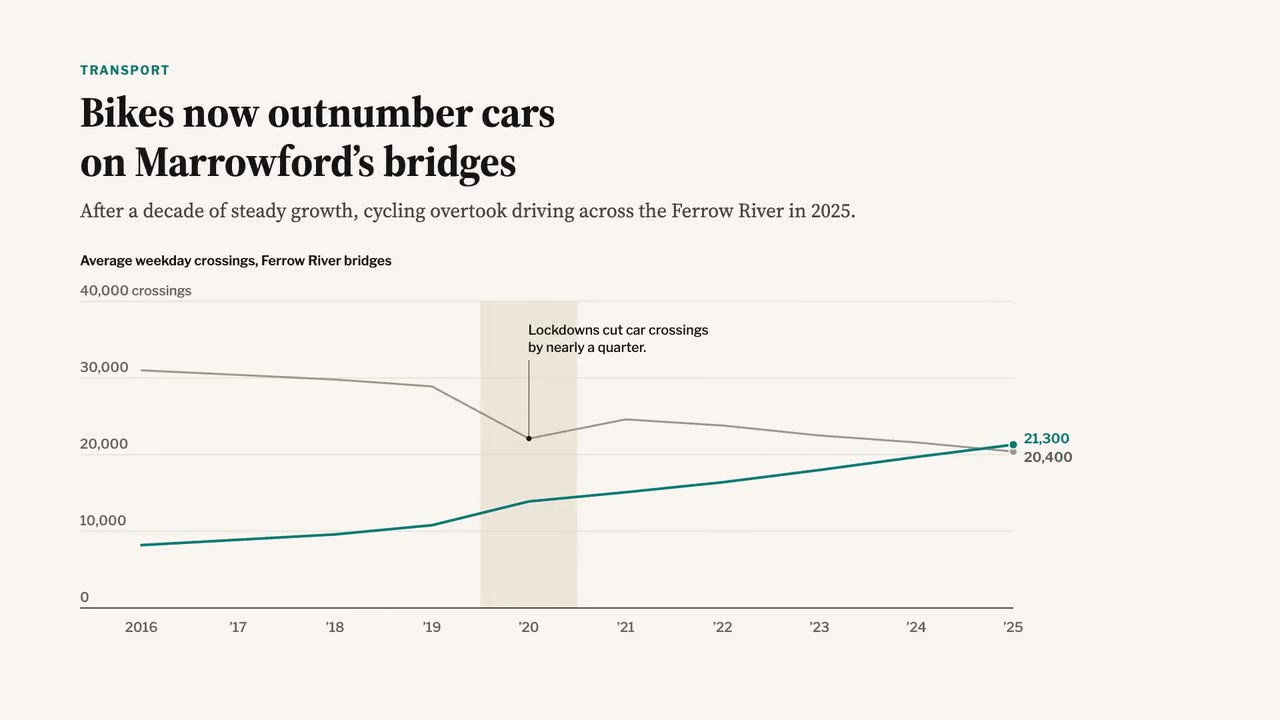
A newspaper-grade animated chart: serif headline and dek, a two-line chart that draws year by year, a shaded 2020 band,…
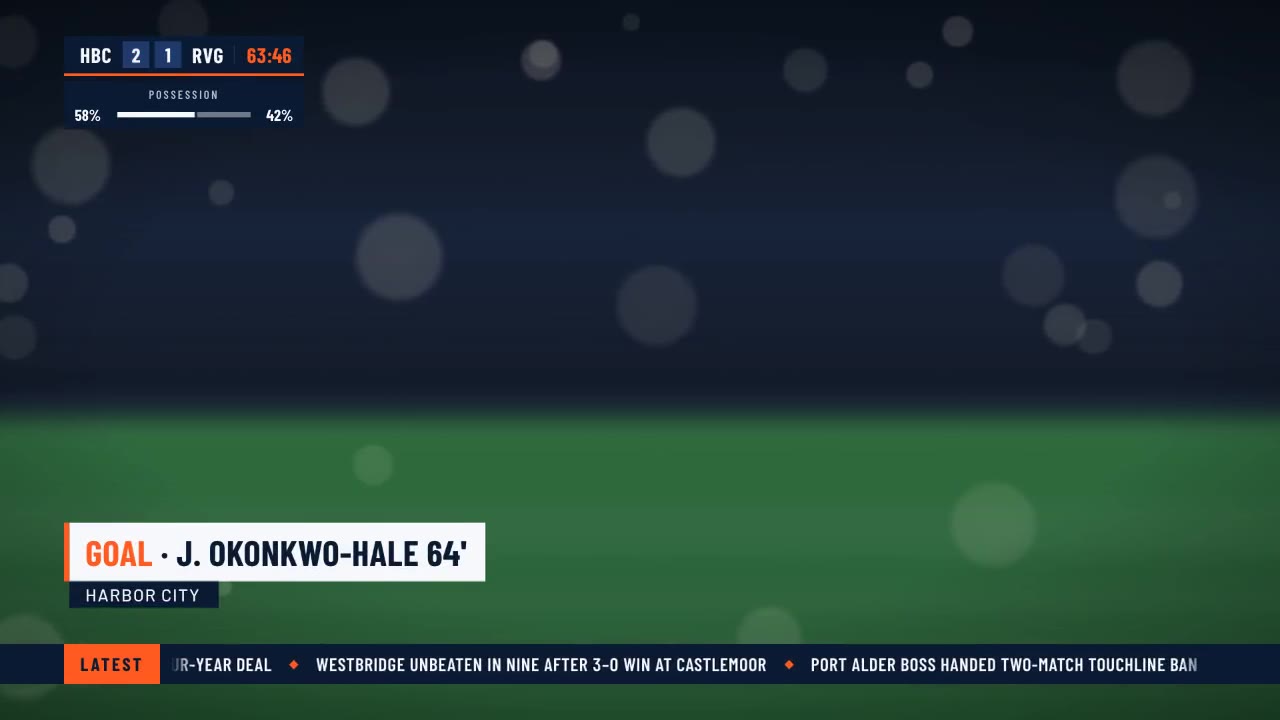
A crisp live-sports graphics package over a soft-focus stadium feed: score bug with running clock, layered lower third,…
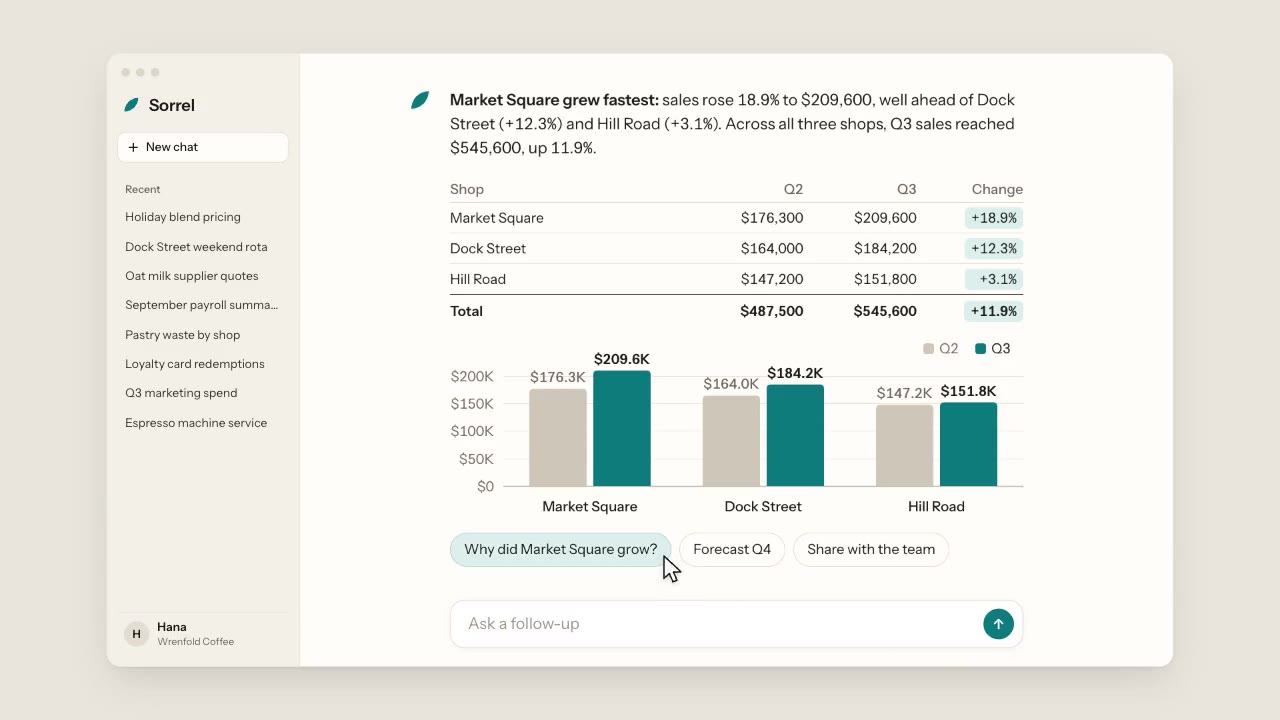
A warm, light chat app: a cursor types a question about three coffee shops, the assistant streams its answer word by wo…
More like this on the motion design inspiration board: Data visualization inspiration