
Premium
Running Route Heatmap
On a dark street map of a fictional city, 212 GPS traces from a year of runs stack into a glowing orange heatmap; then today's run draws as a bright line behind a moving dot while a phone fills in its distance, kilometre splits and an elevation profile.
Written and rendered by AI CSS Animations Nov 2, 2026
- Type
- prompt
- Made with
- Claude Opus 5.5 in Claude Code
- Built in
- Canvas
- Topics
- Maps · Charts · Phone
About this style
Personal heatmaps in running and cycling apps stack every recorded GPS trace on one map, so the routes repeated most often glow brightest and a year of habits shows at a glance. The effect comes from additive blending: each trace adds a little light, and overlapping traces heat from deep orange through yellow toward white. An activity's detail view then breaks a single run into kilometre splits, pace and an elevation profile.
Premium
Unlock the prompt
Everything you see above is live. Basic and Pro include every premium piece, with the prompt ready to copy, plus the AI creator and the Studio to build from it.
Similar prompts
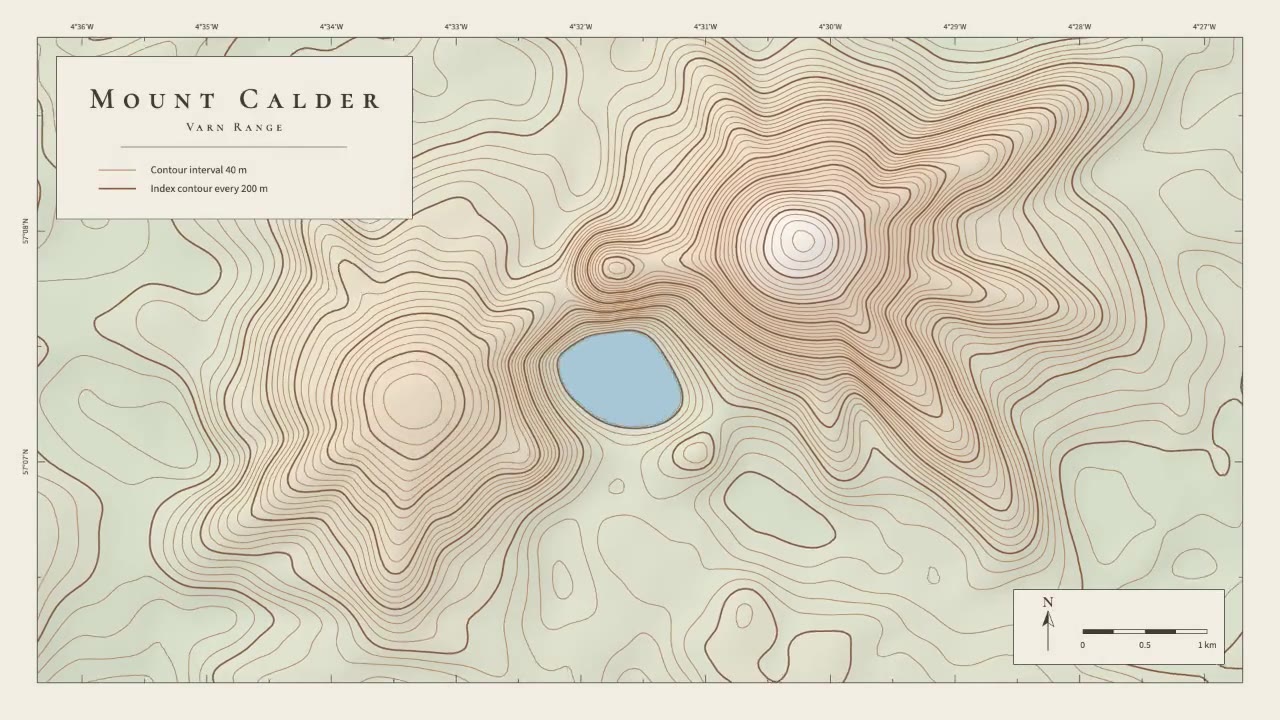
A calm cartographic animation: smooth brown contour lines draw in from valley to summit, the terrain slowly morphs as a…
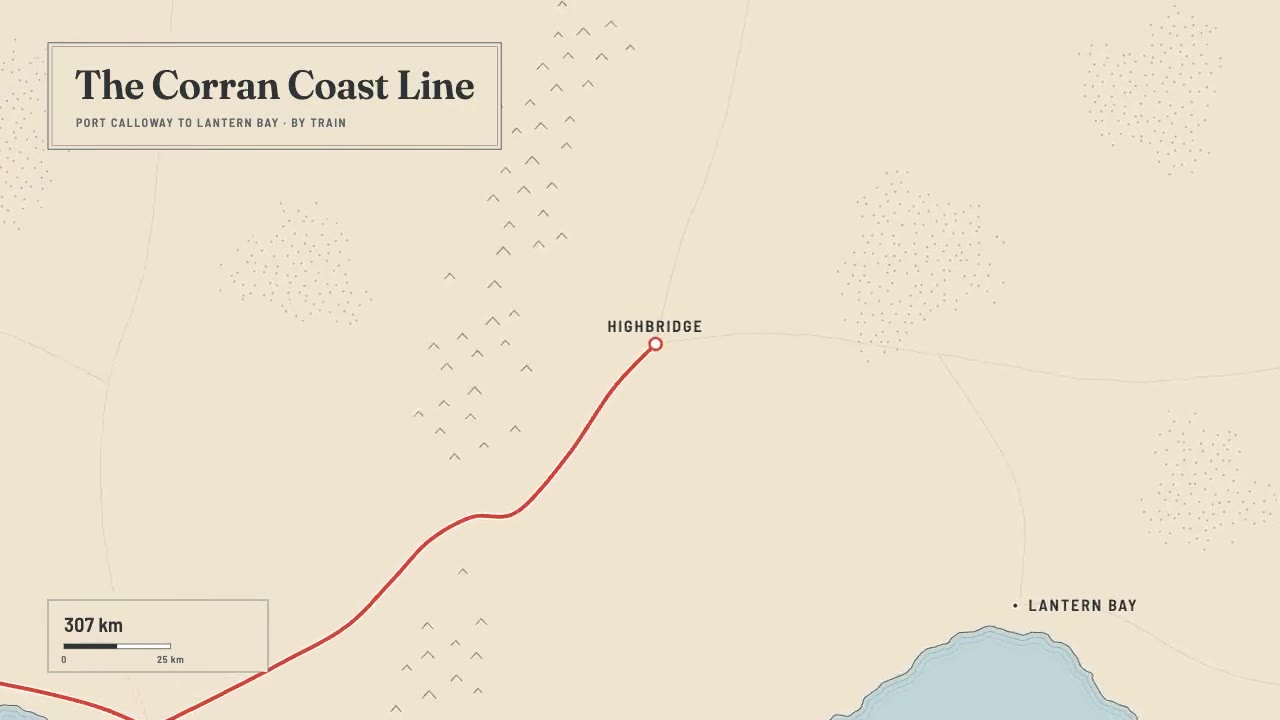
A print-style travel map that draws itself: water-lined coast, ink mountains and serif labels, then a red route line ca…
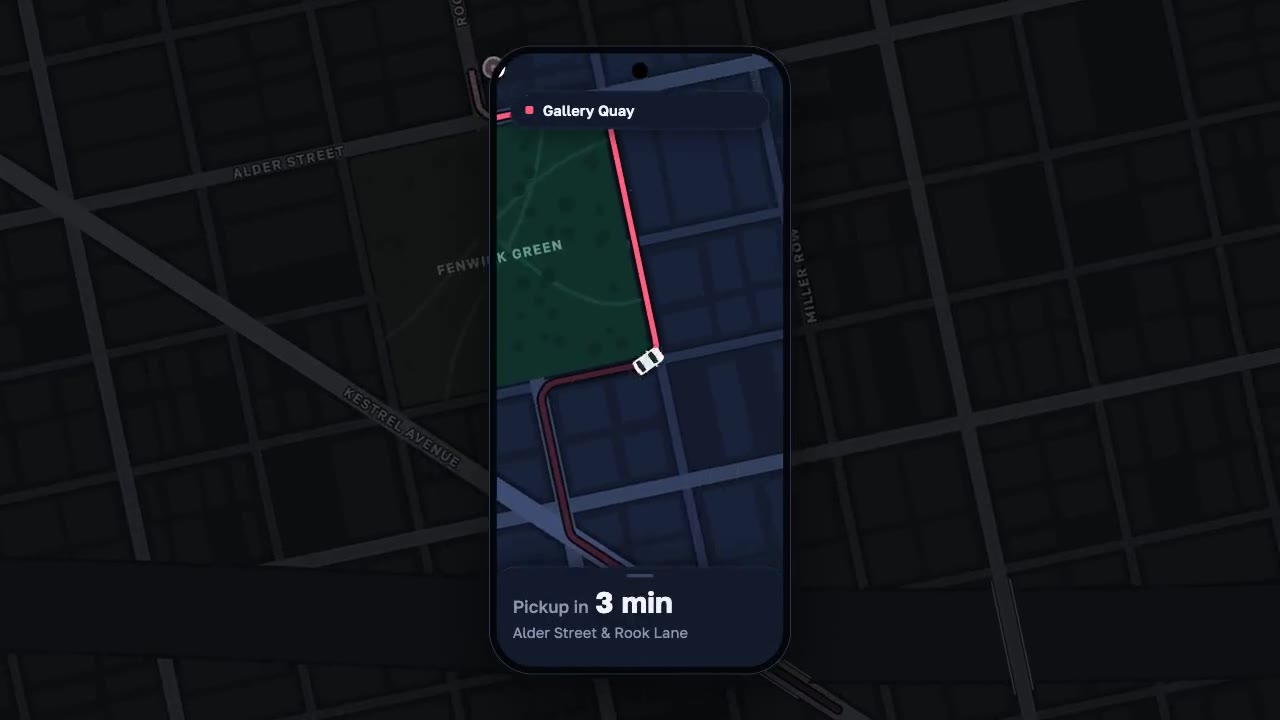
A night map seen through a phone that works like a lens, the city dimmed around it: a coral route draws along procedura…
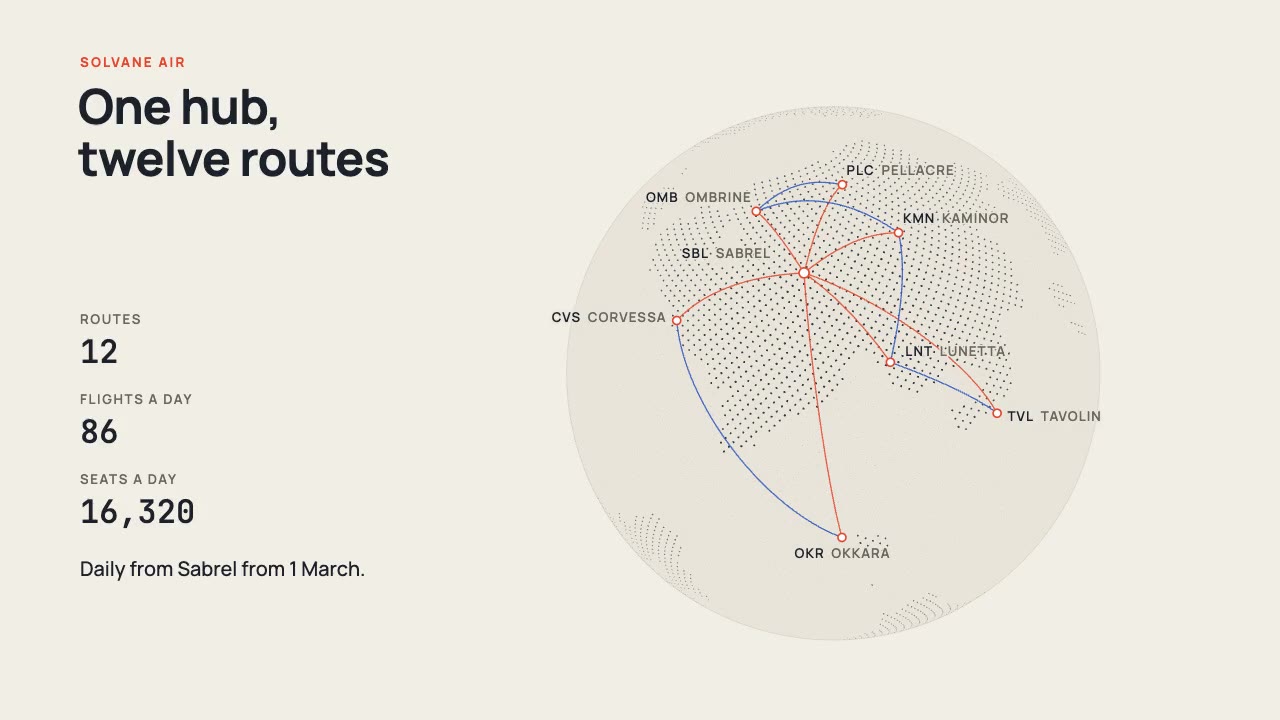
A print-style dotted globe of a fictional world turns on warm paper while vermilion and cobalt arcs fly a new airline's…
More like this on the motion design inspiration board: Data visualization inspirationMap animation inspirationApp animation inspiration