
Habit Heatmap
On night plum, a year-long habit grid fills day by day behind a moving cursor in five steps from plum to amber, counters climbing to 281 days and 112 hours, then a pale outline traces the 46-day summer streak while the rest of the year dims.
Written and rendered by AI CSS Animations Oct 18, 2026
- Type
- prompt
- Made with
- Claude Opus 5.5 in Claude Code
- Built in
- Canvas
- Topics
- Charts
About this style
A calendar heatmap gives each day of a year its own cell, arranged in week columns and weekday rows, and colors the cell by how much happened that day. The layout makes weekly rhythms, seasons, gaps and streaks visible in a single glance. Code-hosting sites made it familiar as a contribution graph, and habit trackers, fitness apps and language-learning apps use it to reward showing up every day. A short sequential ramp, from a quiet empty color to a strong one, keeps the levels in order.
The prompt
Make a 10-second habit-tracker heatmap: a whole year fills in day by day, then the longest streak is traced and the totals land.

<inputs>
If I don't give you something, use the default and don't ask.
- App: Daybrook (fictional). Habit: cello practice. Year: 2026 (1 January is a Thursday).
- Title: "A year of cello"
- Subtitle: "Minutes practiced each day in 2026"
- Totals: 281 of 365 days practiced · longest streak 46 days (3 June – 18 July) · current streak 19 days (13–31 December) · 112 hours in all.
- Levels: none, 1–15, 16–30, 31–45, 46+ minutes.
- Length: 10 seconds.
</inputs>

<direction>
- Palette: night plum ground #17121F with a soft #1F1829 radial lift behind the card; card #201A2B with a 1px #2F2640 border and 24px corners; empty cells #2B2338; levels 1–4 #4E2A5C, #8E3B6E, #DA5868, #FF9E5A, an ordered ramp from plum to amber. Text #F6EEE6, secondary #A898B6; the day cursor and streak outline #FFE3BF.
- Title in "Urbanist" 800, 88px, baseline at (120, 180); subtitle Urbanist 500, 28px, secondary, baseline 236.
- Card: x 96–1824, y 300–900. Grid: 53 week columns × 7 weekday rows, Monday on top, 24px cells with 6px gaps and 5px corners, at x 176–1760, y 400–604; days before 1 January and after 31 December aren't drawn. Weekday labels Mon, Wed and Fri in Urbanist 500, 20px, secondary, right-aligned at x 160; month labels Jan–Dec in Urbanist 600, 20px, secondary, over the first column of each month at y 380.
- Stats, along the card's lower half from y 690, 420px apart from x 160: "Days practiced", "Current streak" and "Total time", each a 22px Urbanist 600 label in secondary over a number in "Roboto Mono" 500, 56px, tabular figures ("281 / 365", "19 days", "112 h"). A level key at the card's lower right: "Less", five 20px swatches, "More", at 20px.
- Data, built once at load and never changed: from the seeded PRNG, each day's chance of practice depends on the season (85% from January to May, 60% in August, 75% otherwise) plus 8% at weekends. Then force 3 June – 18 July and 13–31 December on, and 2 June, 19 July and 12 December off; break any other run longer than 30 days by turning off its middle day; flip seeded days, never the forced ones and never making a run longer than 30, until exactly 281 are on. Minutes: a seeded 10–60 for each practiced day, longer at weekends, then scaled and rounded so they sum to exactly 6,720 (112 hours) with every practiced day at least 5 minutes. All three stats are sums over this grid.
- Fill: the day cursor, a 2px #FFE3BF ring around the current cell, runs from 1 January to 31 December; each cell pops in as it passes (scale 0.6 → 1, opacity 0 → 1 over 0.12 s), and the stats count with it: days so far, the streak ending at the cursor (back to 0 after a missed day) and hours so far. Only digits change; nothing flashes.
- Streak: a 2px #FFE3BF outline follows the stepped boundary of the 46 streak cells, 3px outside them with 4px corners, drawn on by dash offset; while it draws, every other cell dims to 35%, and "Longest streak · 46 days · 3 Jun – 18 Jul" sets above the grid in Urbanist 700, 24px, on a 1px leader to the outline.
- Motion is steady and satisfying: the cursor runs on cubic-bezier(0.45, 0, 0.55, 1), so the year starts and ends gently; text rises 12px as it fades in over 0.5 s on cubic-bezier(0.22, 1, 0.36, 1); nothing bounces.
- Premium: a real calendar with weekday rows and month labels, a ramp that reads as effort, numbers that are the grid's own sums, a streak you can trace. Cheap: random colored squares, a green copy of a code site's graph, confetti on every milestone.
Banned: green ramps, confetti, emoji, flames or trophies, 3D or glowing cells, cells that change after they're filled, stats that don't match the grid, anything flashing more than 3 times per second.
</direction>

<structure>
- 0.0–0.8s: the ground and card fade up; the empty cells appear column by column from the left, 6ms apart; weekday and month labels fade in.
- 0.4–1.2s: the title and subtitle rise in; the stat labels appear with their numbers at 0.
- 1.2–6.0s: the year fills: the cursor runs January to December, cells popping in behind it; spring weeks run warm, August thins out, the long summer run fills unbroken; the numbers climb, the streak count building and falling back.
- 6.0–6.4s: the cursor fades on 31 December; the stats rest at 281 / 365, 19 days and 112 h.
- 6.4–7.6s: the streak outline draws around 3 June – 18 July as the other cells dim; its label sets.
- 7.6–8.4s: the other cells return to full strength; the outline stays; the level key fades in.
- 8.4–10.0s: hold, completely still.
For other lengths, stretch the fill; keep at least 1 s of hold.
</structure>

<build>
- One self-contained index.html (inline CSS and JS), a 1920×1080 (16:9) stage scaled to fit the window, designed for 60fps. No image, video, texture or model files: every shape and texture is generated in code.
- window.seek(t), t in seconds, computes every visual from t alone: no CSS transitions or CSS animations, no setTimeout/setInterval, no state carried between frames, randomness only from a seeded PRNG. Anything cumulative is solved analytically from t or precomputed once at load at a fixed step. Past the end, seek clamps to the last frame.
- Without ?render in the URL, drive seek from requestAnimationFrame so it plays in a browser (loop after a 1s end hold); with ?render, don't start that loop.
- Google Fonts via <link> are fine; await document.fonts.load() for each face before defining window.seek.
- Engine: Canvas 2D, repainting every frame from scratch, the backing store sized from CSS size × devicePixelRatio. Canvas won't fetch fonts itself, so the awaited loads matter.
- The year's data and the streak outline path are computed once at load; the stats at any t are sums over the days the cursor has passed.
</build>

<check>
Before showing me, step through one frame per second (t = 0…10): screenshot each and look at it. Fix overlaps, clipped or cramped text, and anything off-style or Banned. Log the totals from the grid: 281 days, a longest run of exactly 46 days from 3 June to 18 July and no other run that long, 19 days at year's end and 6,720 minutes. Check 1 January sits on Thursday, month labels line up with their first columns, the outline follows the streak's stepped edge, and the 6 s frame shows the full year. Confirm seek(10) and seek(11) match, so the final frame holds.
</check>
Ours, and free to use under CC0: copy it, change it, ship it. No credit needed.
Similar prompts
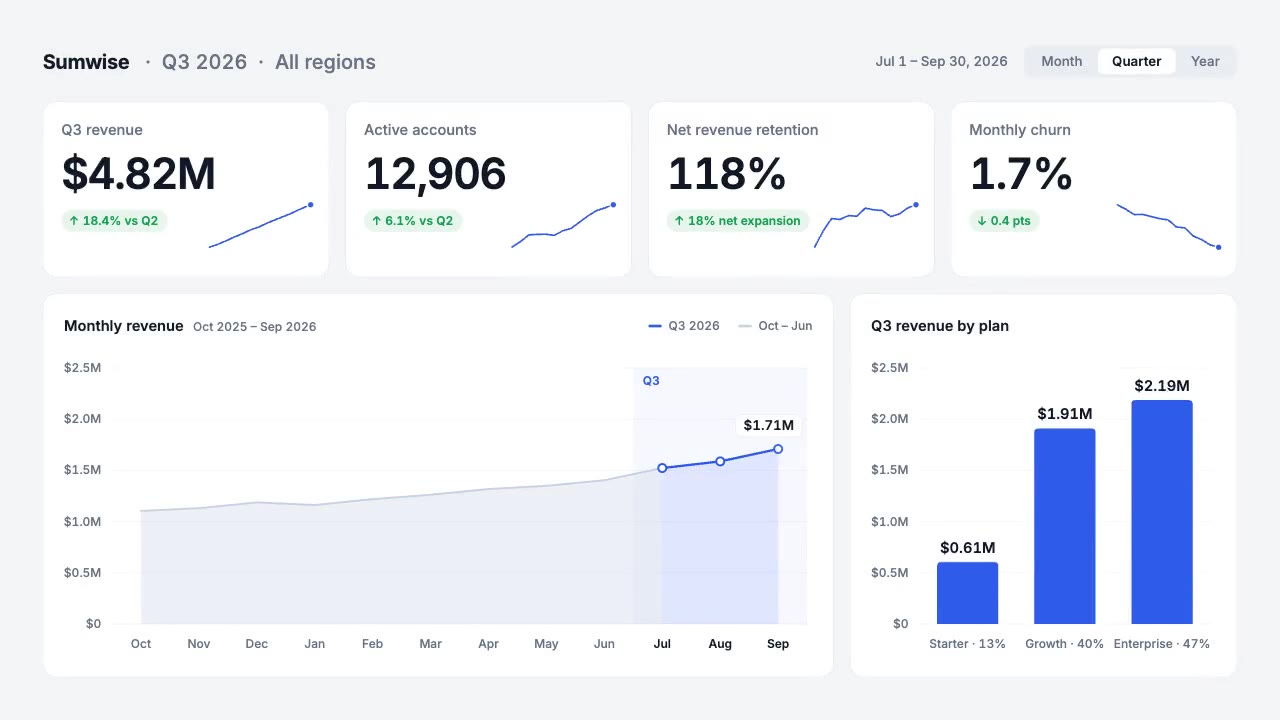
A light analytics dashboard builds itself from fictional data that adds up: counters roll on tabular figures, sparkline…
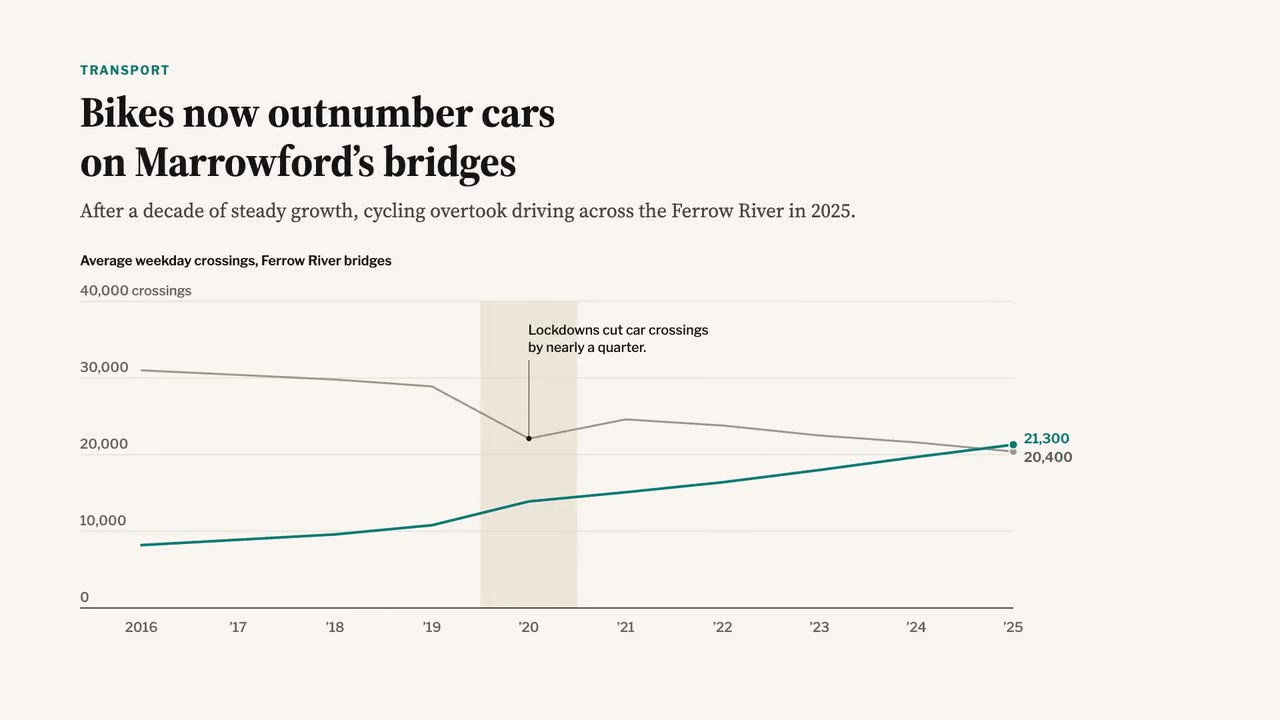
A newspaper-grade animated chart: serif headline and dek, a two-line chart that draws year by year, a shaded 2020 band,…
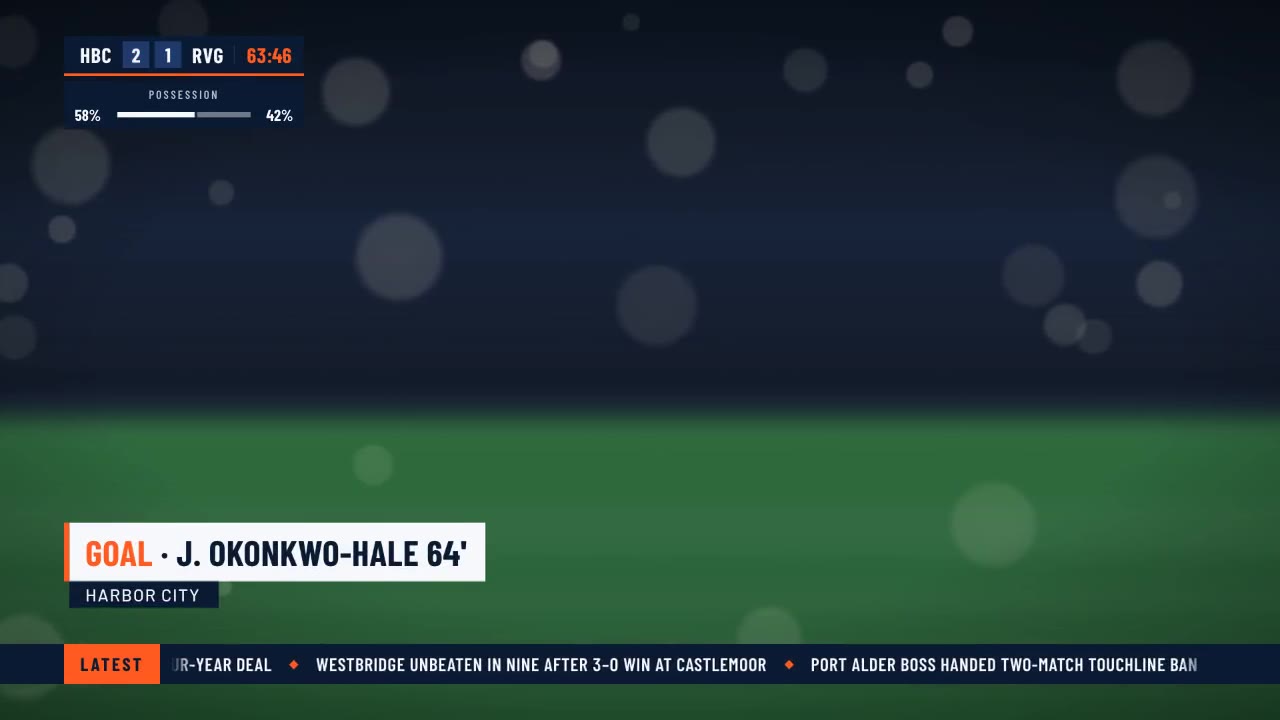
A crisp live-sports graphics package over a soft-focus stadium feed: score bug with running clock, layered lower third,…
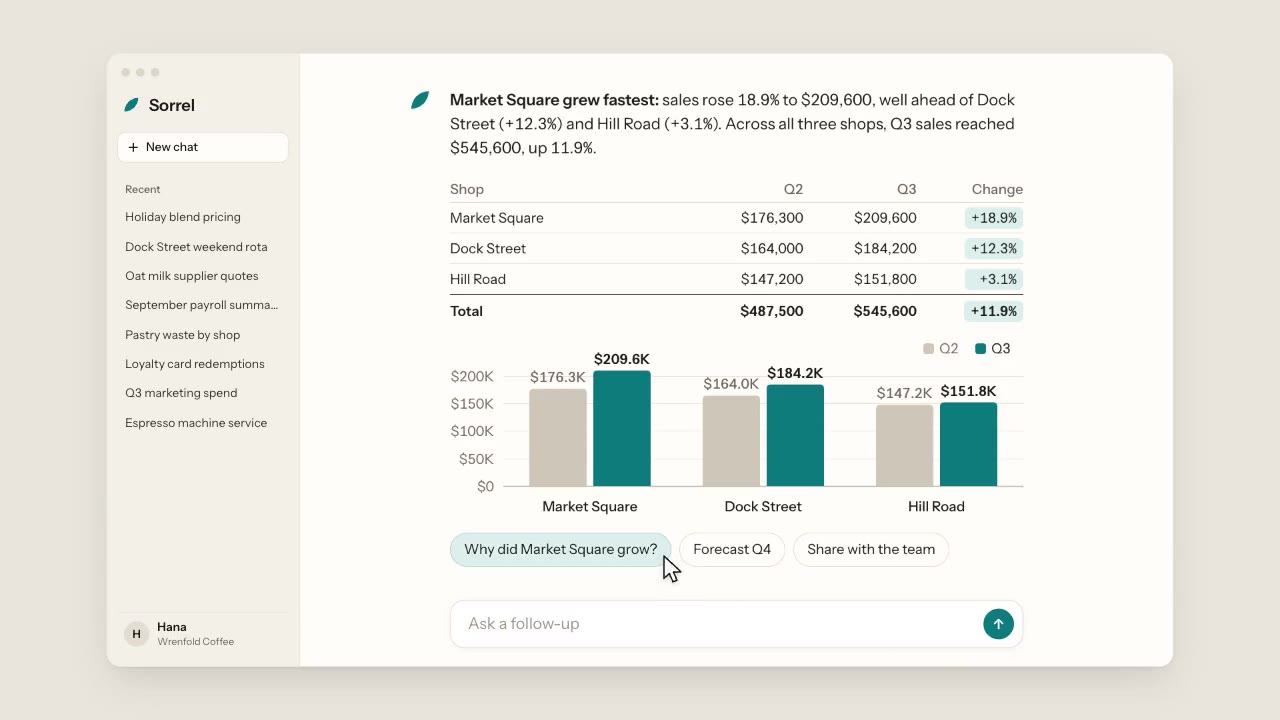
A warm, light chat app: a cursor types a question about three coffee shops, the assistant streams its answer word by wo…
More like this on the motion design inspiration board: Data visualization inspiration