
Bubble Chart Over Time
Sixteen fictional countries glide from 1950 to 2025 as bubbles on a log income and life expectancy chart, a huge pale year counting behind them, while one country leaves a dotted trail through a crisis and recovery and the total population rolls up to 1,293 million.
Written and rendered by AI CSS Animations Oct 18, 2026
- Type
- prompt
- Made with
- Claude Opus 5.5 in Claude Code
- Built in
- SVG
- Topics
- Charts
About this style
Animated bubble charts plot two measures against each other, such as income and life expectancy, size each bubble by population and play the years forward so every country's path becomes visible. The Gapminder Foundation's Trendalyzer software made the form famous, above all through Hans Rosling's 2006 TED talk, and Google bought the software in 2007. A log scale for income, bubble area rather than radius for population and a large year in the background are its signatures. Teachers, statistical agencies and newsrooms still use it to show change over decades.
The prompt
Make a 10-second animated bubble chart: sixteen fictional countries travel from 1950 to 2025, income against life expectancy, bubbles sized by population, a huge year counting behind them.

<inputs>
If I don't give you something, use the default and don't ask.
- Title: "Richer and longer-lived, 1950–2025"
- Dek: "Sixteen fictional countries. Income per person against life expectancy; bubble area shows population."
- Regions and colors: Northlands #4C6EF5, Coastlands #F08C3A, Highlands #23A88F, Islands #E0507A.
- Countries (region; population in millions 1950 → 2025; income per person in dollars a year 1950 → 2025; life expectancy in years 1950 → 2025):
  Aldmere, Northlands; 8 → 11; 6,800 → 52,000; 67 → 83
  Halsund, Northlands; 4 → 6; 5,200 → 46,000; 66 → 82
  Vestholm, Northlands; 22 → 31; 4,600 → 38,000; 64 → 81
  Kirrova, Northlands; 14 → 19; 2,400 → 21,000; 58 → 77
  Brevonia, Coastlands; 31 → 88; 1,500 → 14,000; 47 → 76
  Solmarra, Coastlands; 12 → 37; 1,100 → 9,000; 44 → 73
  Ondessa, Coastlands; 46 → 152; 900 → 5,200; 41 → 69
  Quessa, Coastlands; 6 → 21; 1,800 → 18,500; 50 → 78
  Dunmark, Highlands; 18 → 64; 700 → 4,200; 38 → 68
  Gorvany, Highlands; 27 → 58; 1,300 → 11,000; 49 → 74
  Teshaan, Highlands; 64 → 230; 600 → 3,100; 36 → 66
  Rhoven, Highlands; 9 → 30; 800 → 5,400; 40 → 70
  Irrena, Islands; 140 → 410; 500 → 7,800; 37 → 74
  Mauvel, Islands; 3 → 9; 2,600 → 28,000; 55 → 80
  Coralle, Islands; 2 → 7; 900 → 2,400; 39 → 63
  Lisk, Islands; 38 → 120; 650 → 12,500; 40 → 75
  Total population: 444 million in 1950, 1,293 million in 2025.
- Followed country: Gorvany, whose path runs through 1970 ($2,600, 58 years), 1988 ($6,000, 66), a crisis to 1993 ($3,600, 60) and recovery by 2002 ($6,400, 68).
- Callout: "Gorvany, 1988–1993: income fell 40% and life expectancy 6 years"
- Length: 10 seconds.
</inputs>

<direction>
- Palette: page #F7F6F2; the big year #E6E2D8; gridlines #E4E1D9 at 1px; axis text #6B6962; ink #1D1F24; bubbles filled in their region color at 80% with a 1.5px outline 25% darker.
- Plot: x 220–1780, y 230–930. x is income per person on a log scale from $400 to $64,000 (213px per doubling), gridlines and labels at $500, $1,000, $2,000, $4,000, $8,000, $16,000, $32,000 and $64,000 (labels at y 965); y is life expectancy from 30 to 85 years (12.73px a year), gridlines every 10 years with labels right-aligned at x 200. Axis titles in "Be Vietnam Pro" 500, 20px, axis-text color: "Income per person, dollars a year (log scale)" centered under the plot on baseline y 1010, and "Life expectancy, years" rotated up the left side at x 140.
- The year: the current year in Be Vietnam Pro 800, 380px, #E6E2D8, centered at (1000, 640) behind everything, counting in whole years.
- Bubbles: area proportional to population, radius = 4.2 × √(millions) px, so Irrena grows from about 50px to 85px. Draw the largest first so small bubbles stay on top. Each first appears on a spring with at most 8% overshoot.
- Paths: between 1950 and 2025, each country's income and life expectancy follow smooth S-curves in time, logistic with a seeded midpoint between 1968 and 2000 and a steepness of 0.07–0.12 a year, rescaled to hit both endpoints exactly; income is interpolated in log space, and life expectancy's midpoint runs 8 years ahead of income's. Population grows exponentially between its endpoints. Gorvany instead runs through its keyframes on a monotone cubic in log income and in life expectancy. Every position is a direct function of the year.
- Followed country: Gorvany leaves a trail of 6px dots in its region color at every fifth year it has passed, its label in Be Vietnam Pro 700, 22px, rides beside its bubble on the side away from the crowd, and the callout attaches by a 1px ink leader as it passes 1988 and rides with it to the end.
- Header: the title in Be Vietnam Pro 800, 56px, top-left at (120, 112); the dek in Be Vietnam Pro 400, 24px, axis-text color, beneath; at the top right, the region legend (four 16px dots with names in Be Vietnam Pro 600, 20px), and under it "Total population: 444 million" in Be Vietnam Pro 500, 22px, rolling with the year.
- Final labels: Irrena, Teshaan, Ondessa and Lisk in Be Vietnam Pro 600, 20px, ink, each on a 1px leader, never overlapping each other or a bubble's center.
- Motion: the year runs on easeInOutSine, so the start and the arrival in 2025 are gentle; bubbles glide continuously, never stepping from decade to decade; text rises 12px as it fades in over 0.5 s on cubic-bezier(0.22, 1, 0.36, 1).
- Premium: a log income axis, area-true bubbles, smooth paths, a huge quiet year and one followed country whose trail tells a story. Cheap: linear axes, bubbles scaled by radius, glossy spheres, bubbles hopping from decade to decade.
Banned: 3D or glossy bubbles, gradients, drop shadows, a linear income axis, radius-scaled bubbles, labels on every bubble, real country names, chart libraries, anything flashing more than 3 times per second.
</direction>

<structure>
- 0.0–1.0s: the page; gridlines draw left to right and bottom to top, 30ms apart; axis labels and titles fade in; the header rises in.
- 1.0–1.6s: the sixteen bubbles pop in at their 1950 positions, largest first, 30ms apart; "1950" fades up behind them; the legend and total appear.
- 1.6–7.2s: the years run 1950 → 2025: the crowd drifts up and to the right, Northlands leading, Irrena swelling as it climbs; Gorvany lays its dotted trail, and as it passes 1988 the callout attaches while it slides down and left through its crisis, then recovers; the total rolls up to 1,293 million.
- 7.2–8.2s: the final labels attach, 0.12 s apart.
- 8.2–10.0s: hold on 2025.
For other lengths, stretch the run of years; keep at least 1 s of hold.
</structure>

<build>
- One self-contained index.html (inline CSS and JS), a 1920×1080 (16:9) stage scaled to fit the window, designed for 60fps. No image, video, texture or model files: every shape and texture is generated in code.
- window.seek(t), t in seconds, computes every visual from t alone: no CSS transitions or CSS animations, no setTimeout/setInterval, no state carried between frames, randomness only from a seeded PRNG. Anything cumulative is solved analytically from t or precomputed once at load at a fixed step. Past the end, seek clamps to the last frame.
- Without ?render in the URL, drive seek from requestAnimationFrame so it plays in a browser (loop after a 1s end hold); with ?render, don't start that loop.
- Google Fonts via <link> are fine; await document.fonts.load() for each face before defining window.seek.
- Engine: inline SVG, setting circle positions, radii, text and opacity from seek. No chart libraries.
- Each country's position and population are closed-form functions of the year, and the year is a closed-form function of t.
</build>

<check>
Before showing me, step through one frame per second (t = 0…10): screenshot each and look at it. Fix overlaps, clipped or cramped text, and anything off-style or Banned. Check that bubble areas, not radii, follow population, the income axis doubles every 213px, every bubble stays inside the plot, Gorvany's trail dips and recovers exactly through its keyframes, the total reads 1,293 million in 2025, the big year never covers a label, and the 6 s frame is a full, readable chart in motion. Confirm seek(10) and seek(11) match, so the final frame holds.
</check>
Ours, and free to use under CC0: copy it, change it, ship it. No credit needed.
Similar prompts
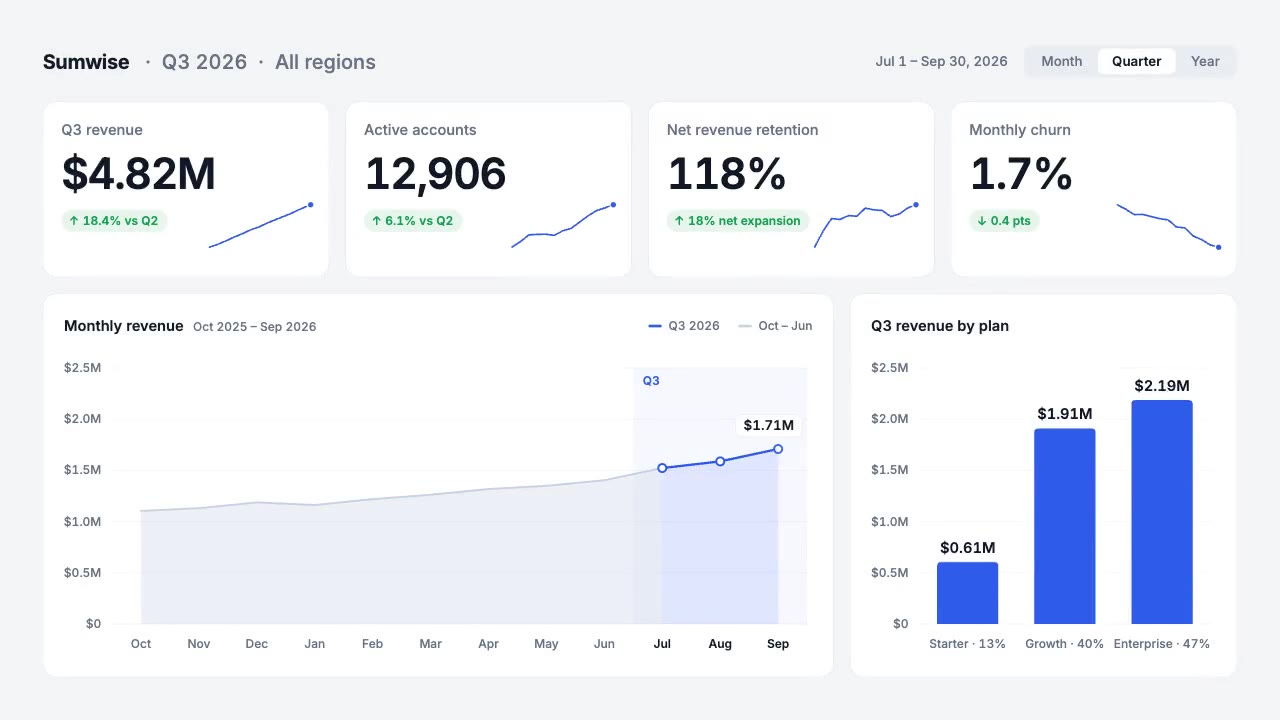
A light analytics dashboard builds itself from fictional data that adds up: counters roll on tabular figures, sparkline…
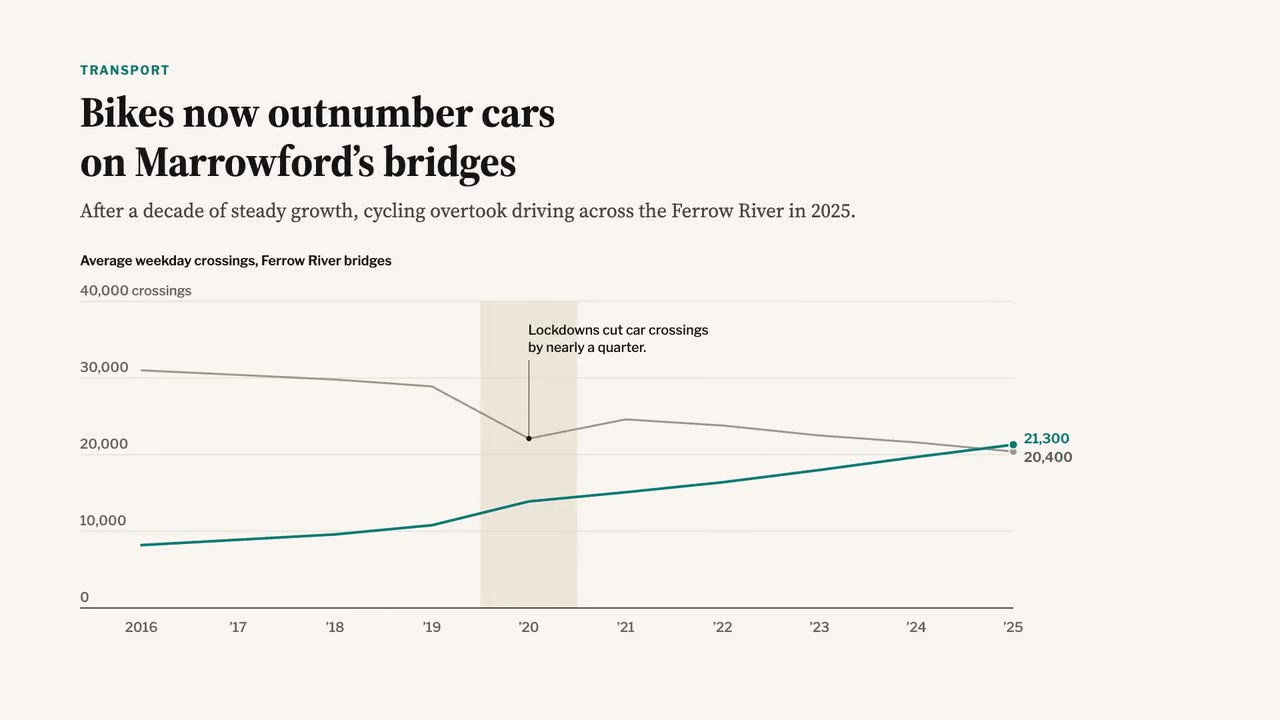
A newspaper-grade animated chart: serif headline and dek, a two-line chart that draws year by year, a shaded 2020 band,…

A crisp live-sports graphics package over a soft-focus stadium feed: score bug with running clock, layered lower third,…
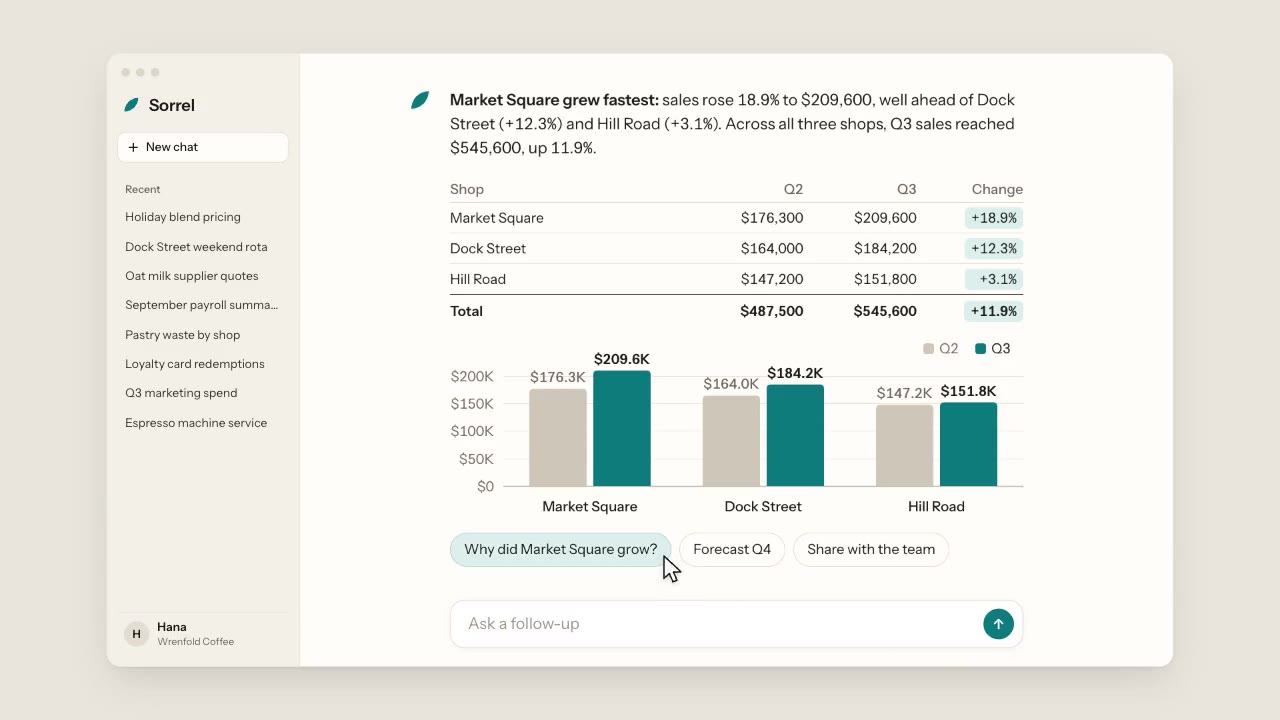
A warm, light chat app: a cursor types a question about three coffee shops, the assistant streams its answer word by wo…
More like this on the motion design inspiration board: Data visualization inspiration