
Beeswarm Chart
On ice blue, 480 half-marathon runners finish as dots that drop into a beeswarm along a time axis while a race clock runs, building a hump near two hours, then turn cobalt and coral and split vertically into returning runners and first-timers, medians 16 minutes apart.
Written and rendered by AI CSS Animations Oct 18, 2026
- Type
- prompt
- Made with
- Claude Opus 5.5 in Claude Code
- Built in
- Canvas
- Topics
- Charts
About this style
A beeswarm chart plots every item as a dot along one axis and nudges the dots off the axis just enough that none overlap, so the shape of the distribution and every individual are visible at once. The name comes from its look: a dense swarm that thins at the edges. It sits between a strip plot, where dots pile on top of each other, and a histogram, which hides individuals inside bars. Newsrooms use it for distributions of people, places or companies, and animated versions split one swarm into groups to compare them.
The prompt
Make a 10-second beeswarm chart: 480 runners finish a half marathon as dots that swarm into a distribution along a time axis, then split into two groups.

<inputs>
If I don't give you something, use the default and don't ask.
- Race: Larchmere Half Marathon 2026 (fictional).
- Title: "480 finishers, one dot each"
- Dek: "Finishing times at the Larchmere Half Marathon: returning runners against first-timers."
- Runners: 304 returning, 176 running their first half marathon (480 in all).
- Times, generated rather than random: returning runner i (0–303) finishes in 113 × e^(0.12·z) minutes and first-timer i (0–175) in 129 × e^(0.13·z), with z = Φ⁻¹((i + 0.5) ÷ n), rounded to the second. That gives a fastest time of 1:19:25, a slowest of 3:04:49, an overall median of 1:58:09, medians of 1:53:00 (returning) and 2:09:00 (first-timers), and a fastest first-timer at 1:30:03.
- Callouts: "Returning runners finished 16 minutes faster at the median." and "Fastest first-timer: 1:30:03"
- Source: "Larchmere Running Club results, 2026. Chip times."
- Length: 10 seconds.
</inputs>

<direction>
- Palette: ice-blue ground #E3EDF2; ink #13233A; secondary #56677A; gridlines #C8D5DD; dots before the split slate #3E5675; returning runners cobalt #2F5BD3; first-timers coral #F2643D.
- Axis: finishing time from 1:10 to 3:10 along x 210–1710 (12.5px per minute); a 2px ink baseline at y 860 with ticks every 10 minutes and labels every 20 (1:20, 1:40 … 3:00) in "Noto Sans Mono" 500, 20px; light 1px gridlines at the labeled ticks from y 250 to 860.
- Dots: 11px across with a 1.5px ring in the ground color, centers at least 13px apart, so every runner stays a separate dot. A dot's x is its time and never changes.
- Layouts, computed once at load: place dots in finishing order, each at the vertical offset nearest its row's center line (searching 0, +0.5, −0.5, +1 … px) where it overlaps no placed dot. Three layouts: everyone on a center line at y 560 (about ±82px tall); returning runners at y 420 (about ±62px); first-timers at y 700 (about ±31px).
- Type: title in "Literata" 700, 60px, top-left at (120, 110); dek in "Public Sans" 400, 24px, secondary, beneath; a race clock at the top right, "Race clock" in Public Sans 600, 20px, secondary, over the time in Noto Sans Mono 500, 40px, tabular figures, right-aligned at x 1800. Group labels in Public Sans 700, 24px, with the count in 400: "Returning runners · 304" to the right of the upper swarm's tail at x 1420, y 430, and "First-timers · 176" above the empty left end of the lower swarm, left-aligned at x 210 on baseline y 660. Median markers are 2px ink ticks 120px tall through each swarm with the time above in Noto Sans Mono 500, 20px. The source at y 1000 in Public Sans 400, 20px, secondary.
- The race: the clock runs from 1:15:00 to 3:05:00 over 1.0–4.0 s, and each runner's dot appears the moment the clock passes their time, dropping 60px into its slot over 0.35 s on easeOutCubic, so the swarm builds from a few fast dots on the left into a dense hump near two hours and a long thinning tail.
- The split: every dot first takes its group color over 0.4 s; then each moves only vertically, from its combined slot to its group slot, over 0.8 s on easeInOutCubic, staggered by finishing time across 0.3 s, so any single runner can be followed.
- Callout: a 2px ink bracket joins the two median ticks across the gap between the swarms at y 575, with "Returning runners finished 16 minutes faster at the median." in Public Sans 600, 24px, to its right; the fastest first-timer gets a small label on a 1px leader.
- Motion is crisp and readable: text rises 12px as it fades in over 0.45 s on cubic-bezier(0.22, 1, 0.36, 1); ticks drop 20px into place over 0.3 s; nothing bounces.
- Premium: every runner a dot, no overlaps, true time positions, a split where dots move only up or down. Cheap: random jitter with overlapping dots, a box plot, a histogram of bars.
Banned: random jitter, overlapping dots, histograms, violin or box outlines, dots moving sideways during the split, 3D, glow, gradients, a third group color, chart libraries, anything flashing more than 3 times per second.
</direction>

<structure>
- 0.0–1.0s: the ground; the baseline draws left to right, ticks and labels fade in; the title and dek rise in; the race clock shows 1:15:00.
- 1.0–4.0s: the race: the clock runs and each runner drops into the swarm as their time passes.
- 4.0–4.6s: the overall median tick drops in at 1:58:09 with its label; a small label marks the fastest dot: "Fastest: 1:19:25".
- 4.7–5.1s: the dots take their group colors, cobalt and coral.
- 5.1–5.9s: the split: cobalt dots rise into the upper swarm and coral dots sink into the lower one, each moving only vertically; the overall median tick fades.
- 6.0–7.0s: the group labels set; each group's median tick drops in at 1:53:00 and 2:09:00.
- 7.0–7.8s: the bracket draws between the medians and its callout rises in; the fastest first-timer gets its label.
- 7.8–8.4s: the source fades in.
- 8.4–10.0s: hold, completely still.
For other lengths, stretch the race; keep at least 1 s of hold.
</structure>

<build>
- One self-contained index.html (inline CSS and JS), a 1920×1080 (16:9) stage scaled to fit the window, designed for 60fps. No image, video, texture or model files: every shape and texture is generated in code.
- window.seek(t), t in seconds, computes every visual from t alone: no CSS transitions or CSS animations, no setTimeout/setInterval, no state carried between frames, randomness only from a seeded PRNG. Anything cumulative is solved analytically from t or precomputed once at load at a fixed step. Past the end, seek clamps to the last frame.
- Without ?render in the URL, drive seek from requestAnimationFrame so it plays in a browser (loop after a 1s end hold); with ?render, don't start that loop.
- Google Fonts via <link> are fine; await document.fonts.load() for each face before defining window.seek.
- Engine: Canvas 2D, repainting every frame from scratch, the backing store sized from CSS size × devicePixelRatio. Canvas won't fetch fonts itself, so the awaited loads matter. No chart libraries; implement Φ⁻¹ with a standard rational approximation.
- The times and all three layouts are computed once at load; each dot's position is a closed-form function of t between them.
</build>

<check>
Before showing me, step through one frame per second (t = 0…10): screenshot each and look at it. Fix overlaps, clipped or cramped text, and anything off-style or Banned. Log the medians, fastest and slowest times and confirm they match the inputs. Check no two dots overlap in any layout, no dot moves sideways during the split, both group labels and the callout sit in clear space, and the 6 s frame shows the two settled swarms. Confirm seek(10) and seek(11) match, so the final frame holds.
</check>
Ours, and free to use under CC0: copy it, change it, ship it. No credit needed.
Similar prompts
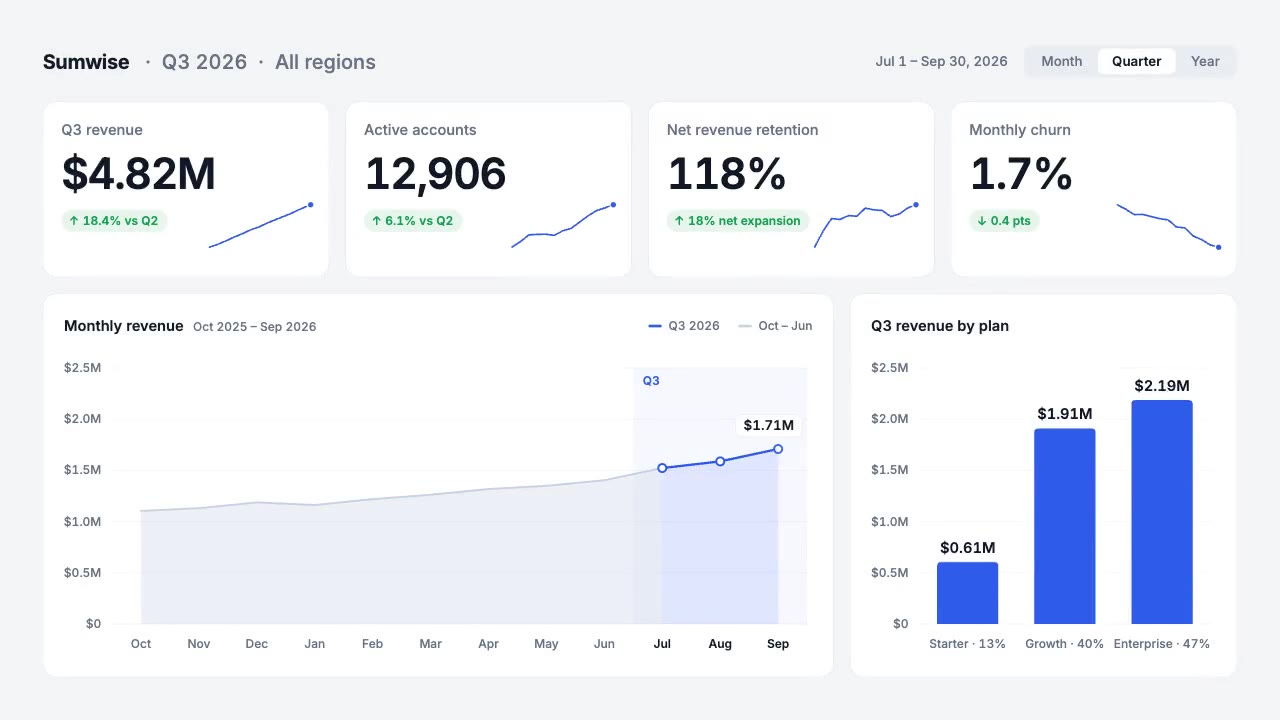
A light analytics dashboard builds itself from fictional data that adds up: counters roll on tabular figures, sparkline…
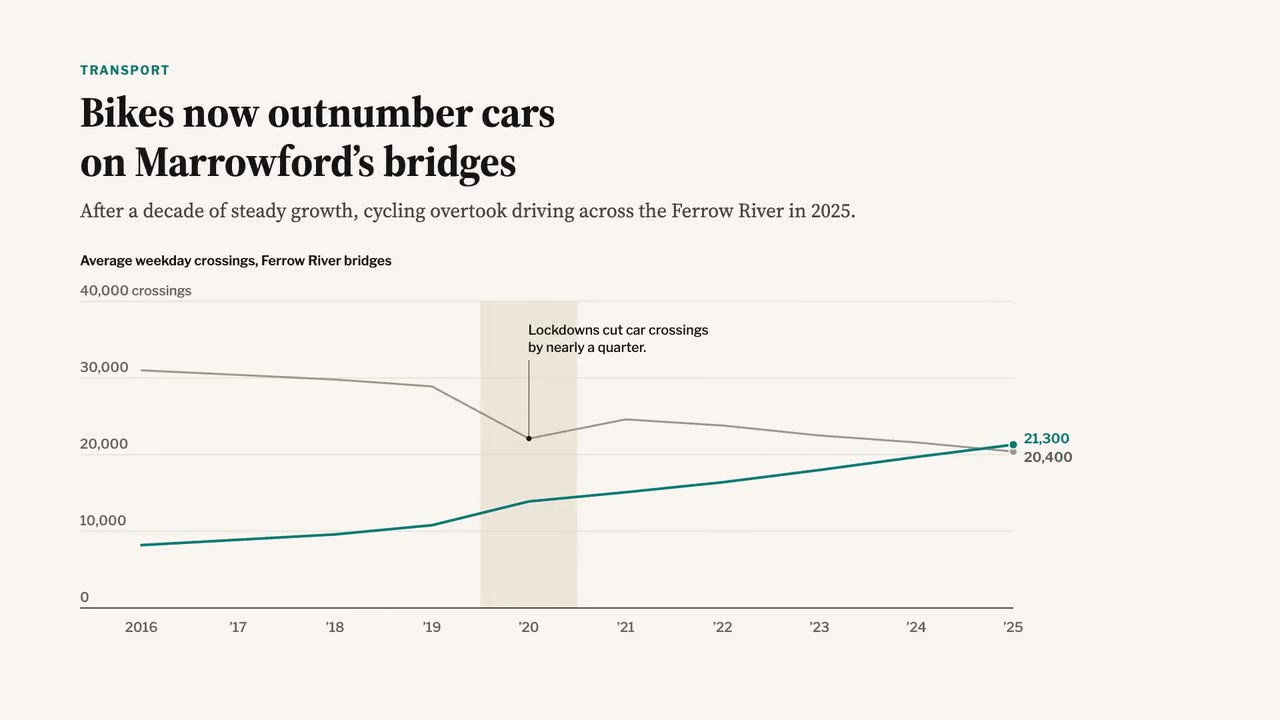
A newspaper-grade animated chart: serif headline and dek, a two-line chart that draws year by year, a shaded 2020 band,…
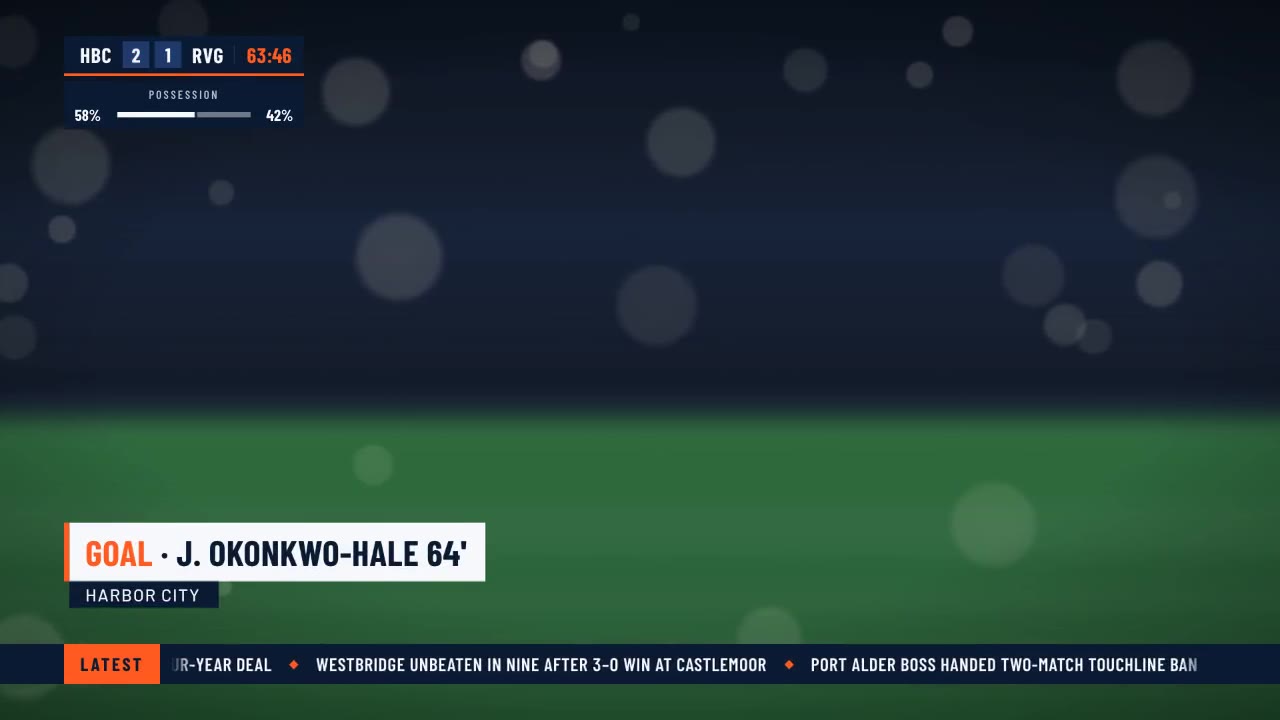
A crisp live-sports graphics package over a soft-focus stadium feed: score bug with running clock, layered lower third,…
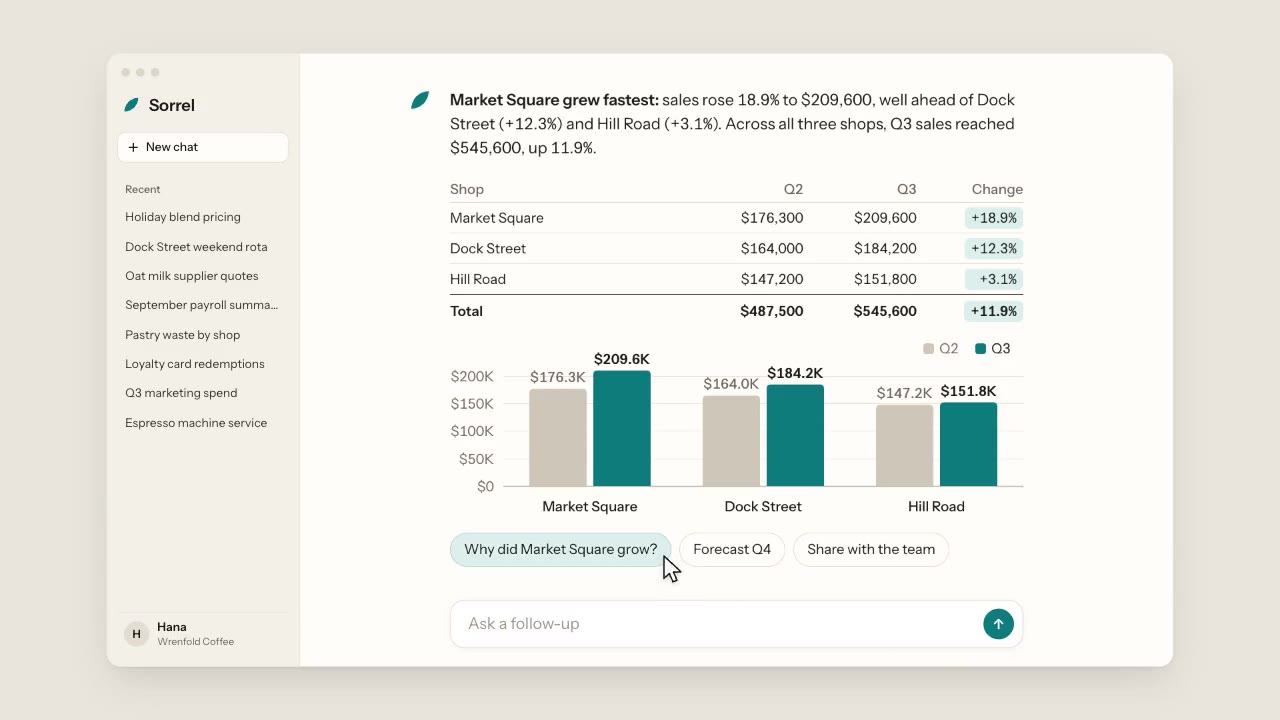
A warm, light chat app: a cursor types a question about three coffee shops, the assistant streams its answer word by wo…
More like this on the motion design inspiration board: Data visualization inspiration