
Premium
Scrollytelling Sticky Chart
A scroll-driven news feature: narrative cards slide up the left column while a sticky chart on the right morphs step by step from a dot plot to grouped bars to an annotated highlight. Scroll position drives the chart, and a scripted, wheel-like scroll plays it for the preview.
Written and rendered by AI CSS Animations Nov 2, 2026
- Type
- prompt
- Made with
- Claude Opus 5.5 in Claude Code
- Built in
- HTML/CSS
- Topics
- Interactive · Charts · Landing page
About this style
Scrollytelling ties a story's graphics to the reader's scroll: text steps through the narrative in one column while a chart or map stays pinned in view and changes at each step. News graphics desks popularised it in the early 2010s, The New York Times' Snow Fall (2012) is the usual landmark for scroll-driven storytelling, and libraries such as Scrollama made the sticky-graphic pattern standard. Its strength is pacing: each step changes one thing, so the reader sees exactly what the sentence describes.
Premium
Unlock the prompt
Everything you see above is live. Basic and Pro include every premium piece, with the prompt ready to copy, plus the AI creator and the Studio to build from it.
Similar prompts
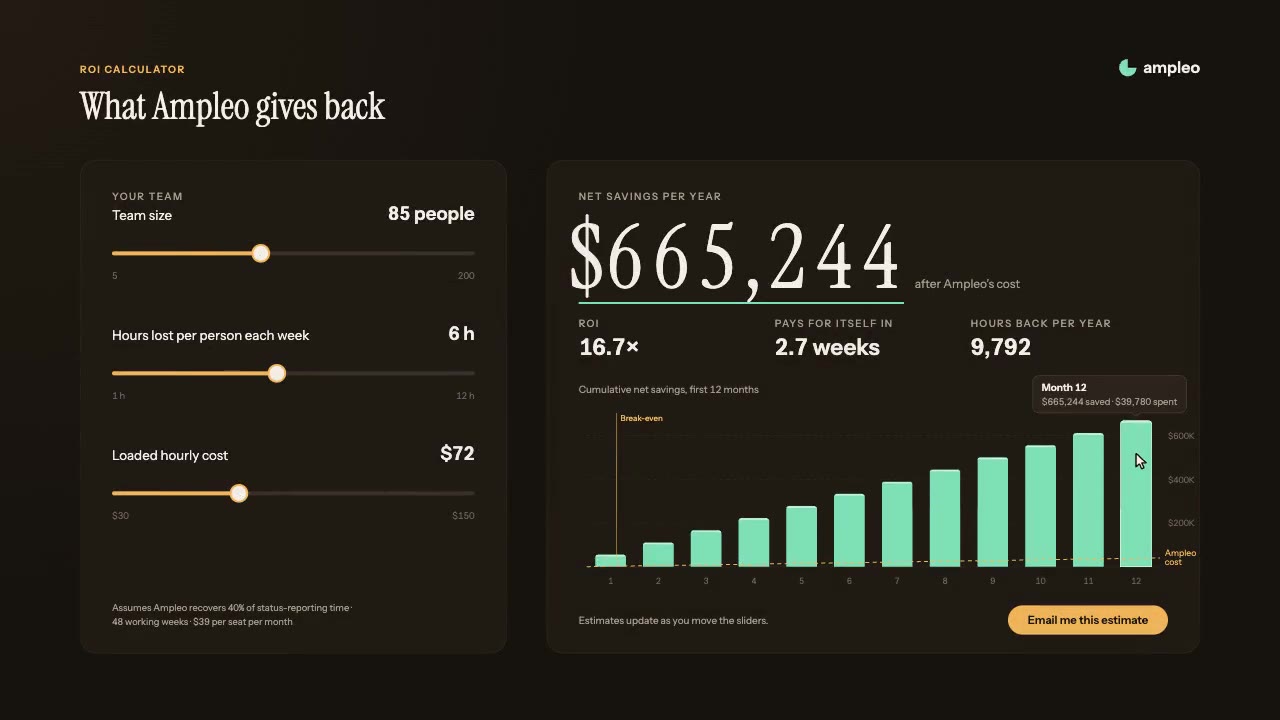
A dark ROI calculator where a cursor drags three sliders (team size, hours lost per week, hourly cost) and the net savi…

A pitch-dark landing hero where the pointer is a warm torch: a soft radial mask reveals a night-forest illustration and…
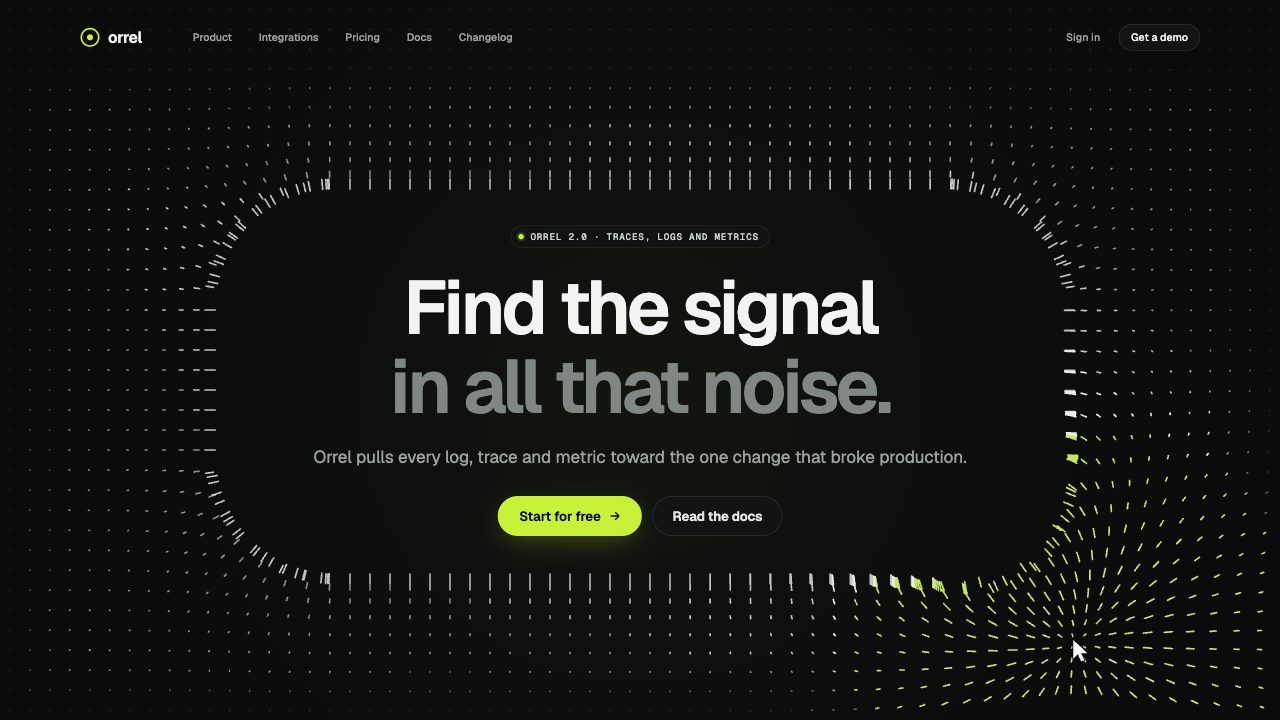
A dark landing-page hero where a 64 by 36 field of hairline dots leans toward the cursor like iron filings and springs…

An interactive three.js camera-focus explainer: turn the focus ring and the glass elements shift, sliding the plane of…
More like this on the motion design inspiration board: Data visualization inspirationLanding page animation inspiration