
Sankey Flow
A fictional gear maker's $380M of revenue pours left to right in proportional ribbons on a white report page: gray revenue splits into green profit and red costs, every node counts up, the profit path is spotlit with margin chips, and a footer shows the sums add up.
Written and rendered by AI CSS Animations Oct 16, 2026
- Type
- prompt
- Made with
- Claude Opus 5.5 in Claude Code
- Built in
- SVG
- Topics
- Charts · Diagrams
About this style
Sankey diagrams draw flows as bands whose widths are proportional to quantity, so every split and merge stays honest at a glance. They are named after the Irish engineer Matthew Henry Phineas Riall Sankey, who used one in 1898 to show the energy efficiency of a steam engine; Charles Joseph Minard's 1869 map of Napoleon's Russian campaign is a famous earlier flow map. Today they are a staple for energy balances, budgets and the income statements companies and analysts share around earnings.
The prompt
Make a 10-second animated Sankey diagram: a fictional company's revenue pours in from three sources and splits into costs, tax and profit, every ribbon exactly as wide as the money it carries.

<inputs>
- Company: Saltmere Supply Co., a fictional outdoor-gear maker.
- Title: "Where Saltmere's money went". Subtitle: "Fiscal year 2026, $ millions · fictional company".
- Flows, $M:
  - Online store 182, Retail stores 126, Wholesale 72 → Revenue 380
  - Revenue → Gross profit 209, Cost of goods 171
  - Gross profit → Operating profit 68, Operating expenses 141
  - Operating expenses → Staff & admin 58, Marketing 46, Logistics 23, Product design 14
  - Operating profit → Net profit 53, Tax 15
- Margin chips: "Gross margin 55.0%", "Operating margin 17.9%", "Net margin 13.9%".
- Footer: "$380M in = $171M goods + $141M operating + $15M tax + $53M profit".
- Length: 10 seconds.
If I don't give you something, use the default and don't ask.
</inputs>

<direction>
Palette: page #FBFAF7, ink #1A1C20, secondary #6B6F78, hairlines #E3E1DB. Three colors, three meanings: revenue gray #8E98A8, profit green #12936A, cost red #D9503F. Sources and Revenue are gray; Gross profit, Operating profit and Net profit are green; every other node is red. Nodes are solid 16px-wide bars with square ends. A ribbon takes the color of the node it flows into, at 40% opacity.
Type: title "Newsreader" 600, 60px, sentence case; everything else "Public Sans": subtitle 400, 26px, secondary; node names 600, 22px; node values 700, 28px; chips 600, 22px; footer 400, 20px. Values use tabular figures and read "$380M".
Geometry: columns at x 280, 610, 940, 1270 and 1560 (node left edges); k = 1.5px per $1M, so Revenue is 570px tall. Stacks, top to bottom: sources at y 300–573, 603–792 and 822–930; Revenue 330–900; Gross profit 300–613.5, Cost of goods 653.5–910; Operating profit 280–382, Operating expenses 422–633.5; column five from y 234: Net profit, a 26px gap, Tax, a 40px gap, then Staff & admin, Marketing, Logistics and Product design with 22px gaps, ending at y 679.5. Each ribbon is a band bounded by two cubic Béziers with horizontal tangents (control points at half the horizontal distance), exactly value × k wide at both ends, stacked at its source in target order and at its target in source order, so no two ribbons cross.
Labels: source labels right-aligned at x 264, name above value. Terminal labels (column five and Cost of goods) sit 14px right of their node on one line, name then value, vertically centered. Revenue, Gross profit and Operating profit carry name over value above their node; Operating expenses below its node. No label ever sits on a ribbon.
Title top-left at x 120, baselines y 118 and 160. Footer bottom-left at x 120, baseline y 1000.
Motion is a pour. A ribbon reveals from source to target with a clip edge advancing over 0.6s on cubic-bezier(0.65, 0, 0.35, 1); its target node grows from its vertical center in step with what has arrived, and the node's value counts up with it. Siblings start 120ms apart. Labels fade in and rise 10px over 0.35s once their node is full. Chips scale 0.92 → 1 and fade in over 0.3s on cubic-bezier(0.22, 1, 0.36, 1): white fill, 1px green border, 8px radius, green text, placed beside their node clear of every ribbon.
The real thing is an honest ledger: widths exactly proportional, no crossings, color that means something, every node's inflow equal to its outflow. The cheap version is rainbow ribbons, gradients along the flows and labels lying across them.
Banned: per-ribbon or rainbow colors, gradients, shadows, glow, 3D, rounded node caps, crossing ribbons, numbers that don't sum, chart libraries, emoji, anything flashing more than 3 times per second.
</direction>

<structure>
0.0–0.8s: title and subtitle rise 14px and fade in; a 1px hairline draws under them, left to right.
0.8–1.6s: the three source nodes grow, 120ms apart; their values count up to $182M, $126M and $72M.
1.6–2.6s: three gray ribbons pour into Revenue; it grows with them and counts to $380M.
2.6–3.6s: Revenue splits: green to Gross profit ($209M), red to Cost of goods ($171M).
3.6–4.6s: Gross profit splits into Operating profit ($68M) and Operating expenses ($141M).
4.6–5.8s: Operating profit pours into Net profit and Tax; Operating expenses fans into its four nodes, 120ms apart.
5.8–6.6s: the footer writes on with a left-to-right clip.
6.6–8.2s: everything off the profit path (Revenue → Gross profit → Operating profit → Net profit) fades to 18%; the three chips pop in beside their nodes, 150ms apart.
8.2–8.8s: the rest returns to full strength; the chips stay.
8.8–10.0s: hold, nothing moving.
For other lengths, scale every beat proportionally; keep each pour at least 0.5s and the hold at least 1s.
</structure>

<build>
One self-contained index.html, CSS and JS inline. Google Fonts via <link> are fine; no other libraries. Draw in inline SVG whose attributes seek sets directly; no canvas or three.js needed. Await document.fonts.load() for every face before defining window.seek. The stage is 1920×1080 (16:9), scaled to fit the window. Design for 60fps. window.seek(t), t in seconds, must compute every visual from t alone: no CSS transitions or animations, no setTimeout or setInterval, no state carried between frames, and randomness only from a seeded PRNG. Without ?render in the URL, drive seek from requestAnimationFrame so it plays in a browser (loop after a 1s end hold); with ?render, don't start that loop.
</build>

<check>
Before showing me, step through one frame per second: screenshot each and look at it. Fix overlaps, clipped or cramped text, accidental edge collisions, and anything off-style or Banned. Measure every ribbon at both ends against value × 1.5px and confirm each node's inflow equals its outflow. Check that ribbons never cross, labels and chips never touch a ribbon, and the footer's sums match the data. Confirm seek(duration) and seek(duration + 1) match, so the final frame holds.
</check>
Ours, and free to use under CC0: copy it, change it, ship it. No credit needed.
Similar prompts
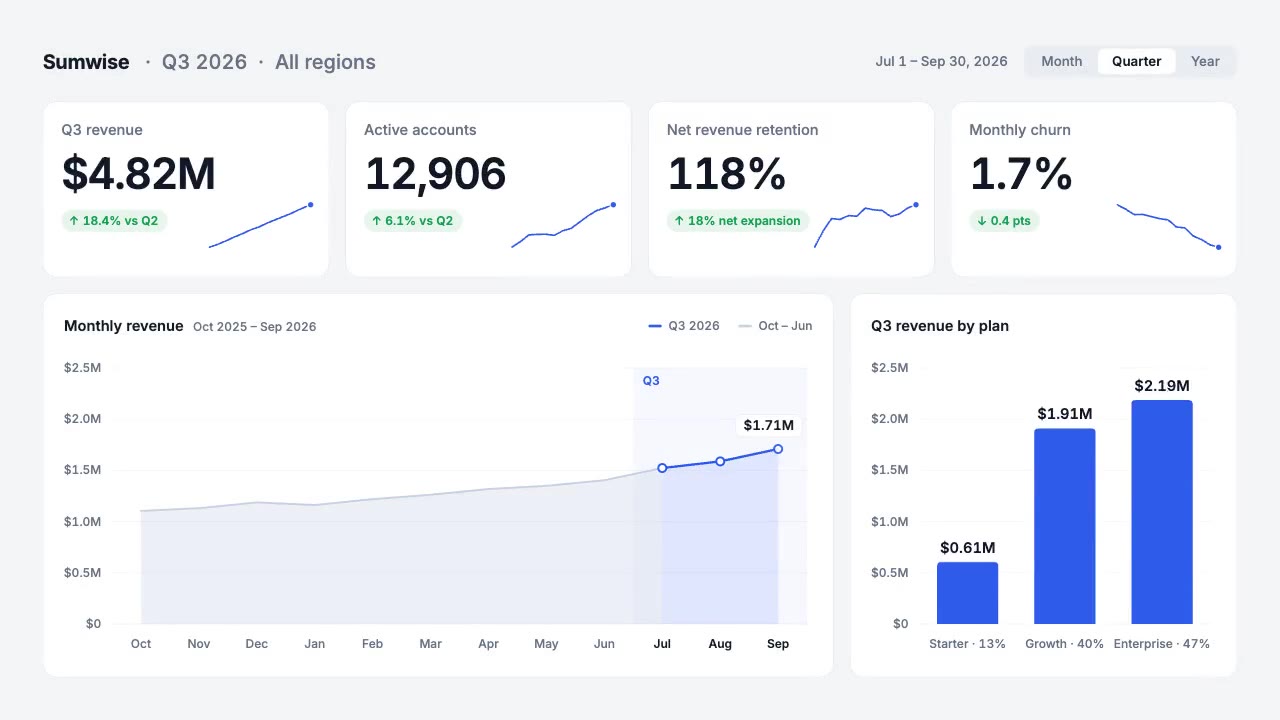
A light analytics dashboard builds itself from fictional data that adds up: counters roll on tabular figures, sparkline…
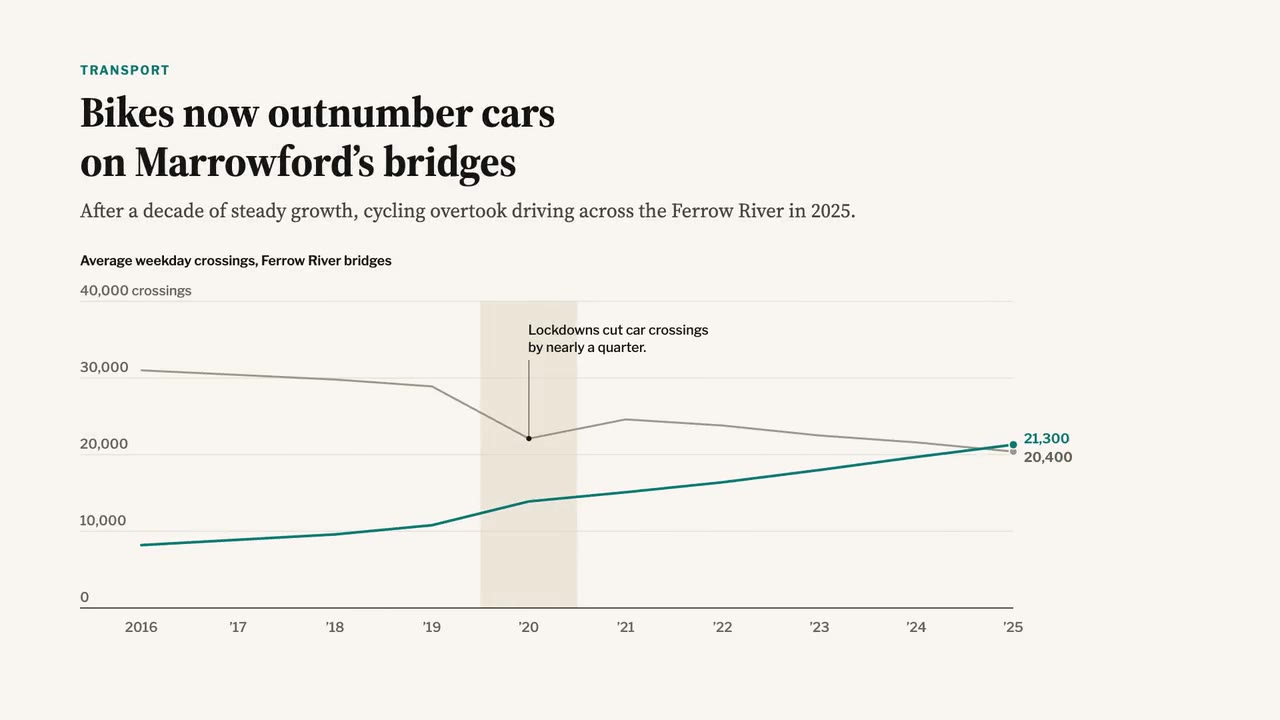
A newspaper-grade animated chart: serif headline and dek, a two-line chart that draws year by year, a shaded 2020 band,…
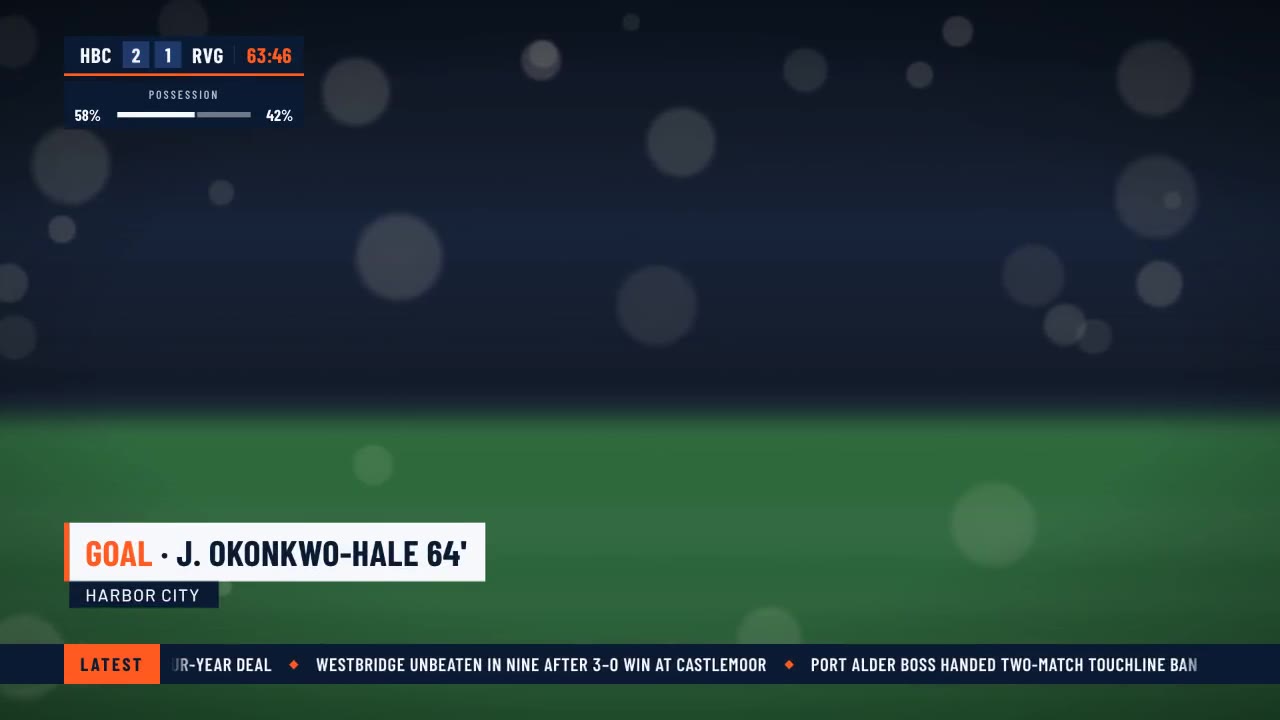
A crisp live-sports graphics package over a soft-focus stadium feed: score bug with running clock, layered lower third,…
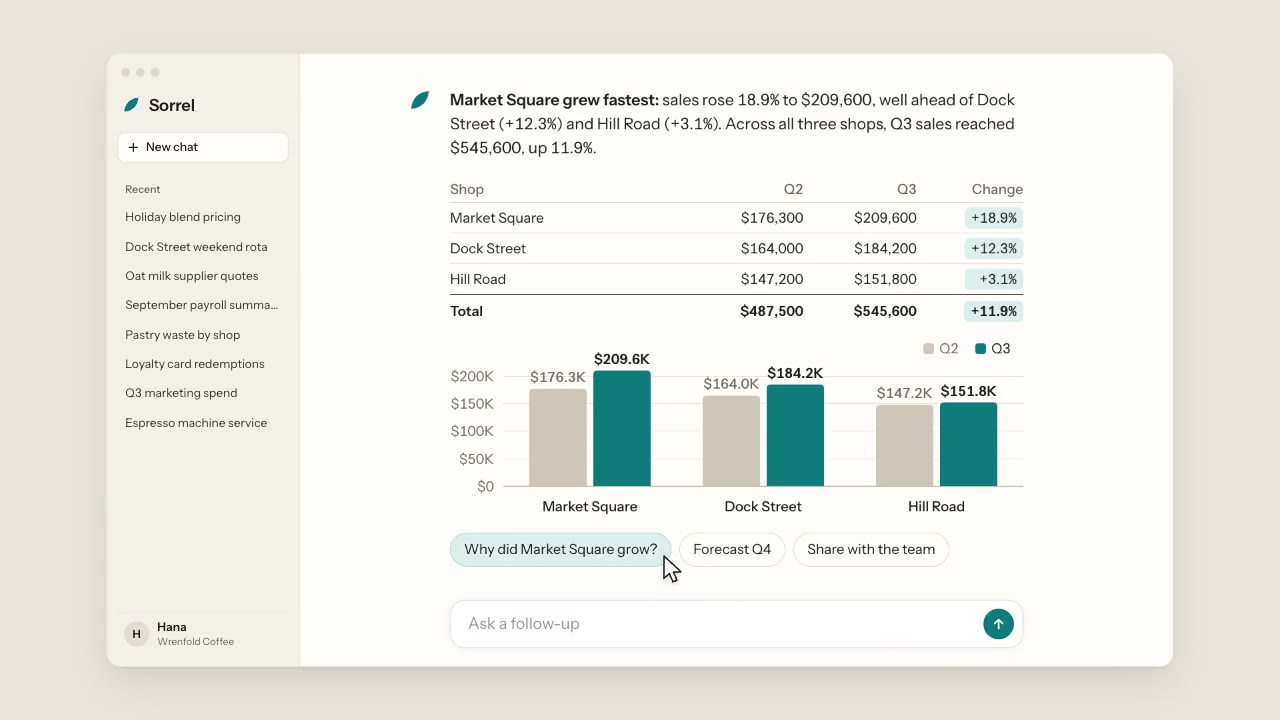
A warm, light chat app: a cursor types a question about three coffee shops, the assistant streams its answer word by wo…
More like this on the motion design inspiration board: Data visualization inspirationDiagram animation inspiration