
Premium
Minard Flow Map
A 19th-century figurative map on aged paper: a fictional caravan marches out as a tan band as wide as its travellers, notching thinner at every river, splits a party north, then marches home in black while a temperature line prints beneath it in step, with copperplate labels.
Written and rendered by AI CSS Animations Nov 2, 2026
- Type
- prompt
- Made with
- Claude Opus 5.5 in Claude Code
- Built in
- SVG
- Topics
- Maps · Charts
About this style
Charles Joseph Minard, a French civil engineer, drew his figurative map of Napoleon's 1812 Russian campaign in 1869: the army is a band whose width is its size, tan on the way to Moscow and black on the retreat, with the temperature plotted beneath the return. It shows six variables at once on one sheet, and the statistician Edward Tufte has called it perhaps the best statistical graphic ever drawn. Its flow-map idea lives on in Sankey diagrams, migration maps and data journalism.
Premium
Unlock the prompt
Everything you see above is live. Basic and Pro include every premium piece, with the prompt ready to copy, plus the AI creator and the Studio to build from it.
Similar prompts
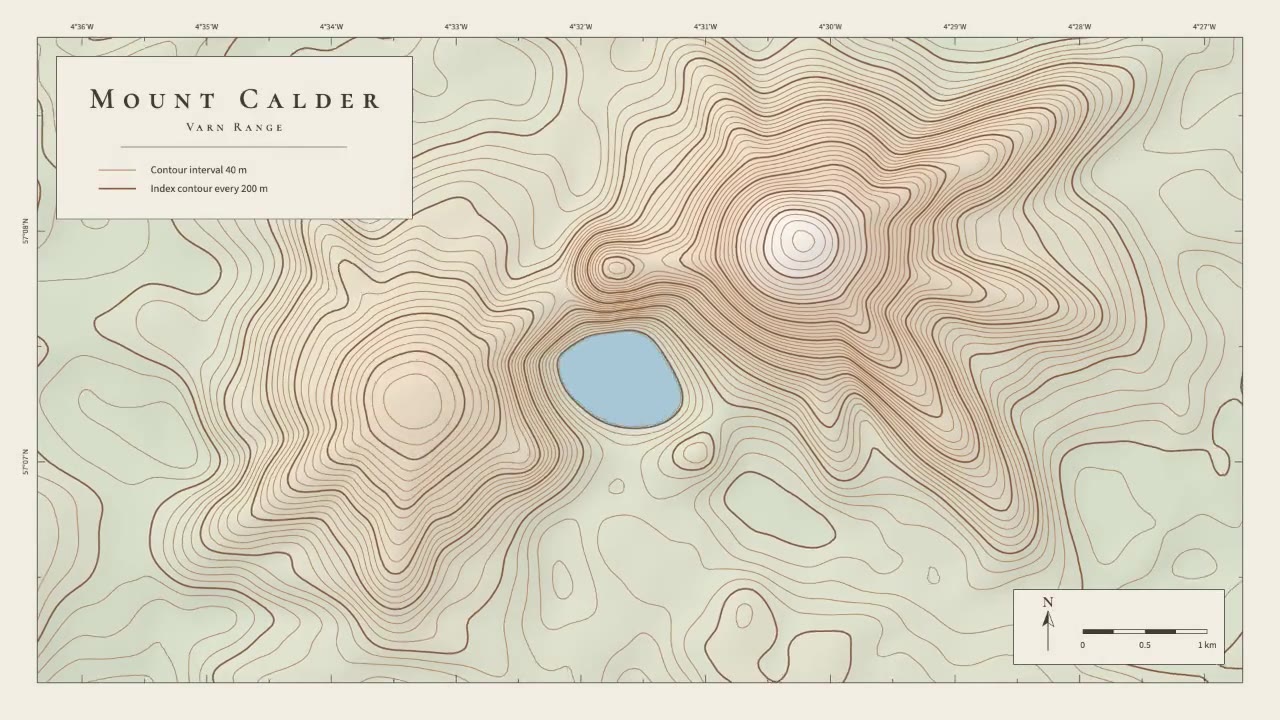
A calm cartographic animation: smooth brown contour lines draw in from valley to summit, the terrain slowly morphs as a…
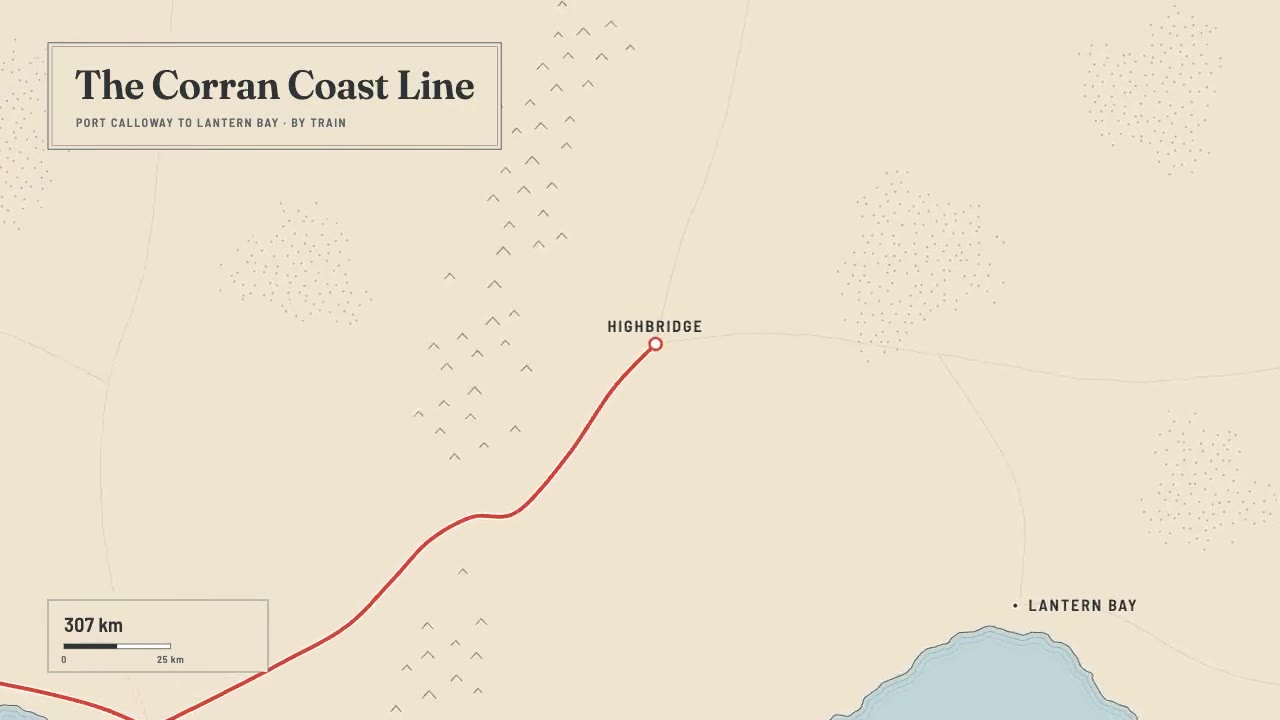
A print-style travel map that draws itself: water-lined coast, ink mountains and serif labels, then a red route line ca…

A night map seen through a phone that works like a lens, the city dimmed around it: a coral route draws along procedura…
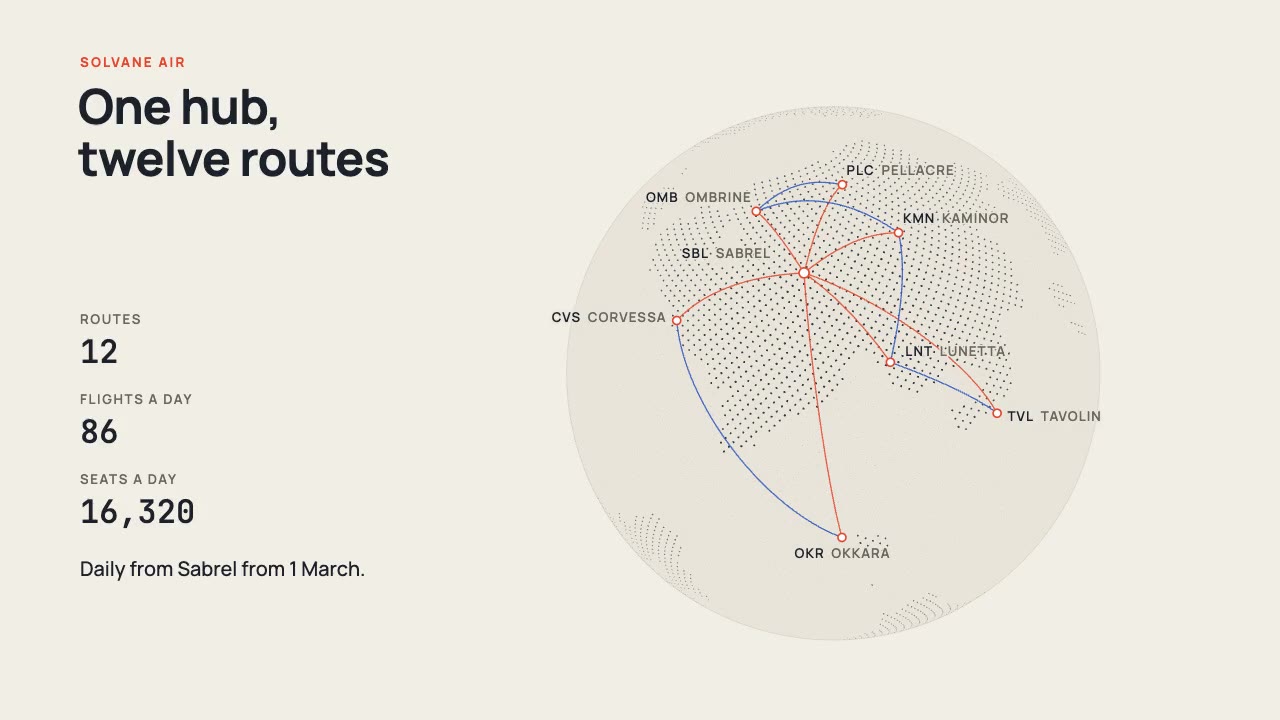
A print-style dotted globe of a fictional world turns on warm paper while vermilion and cobalt arcs fly a new airline's…
More like this on the motion design inspiration board: Data visualization inspirationMap animation inspiration