
Math Explainer
A dark calculus explainer: the curve x³ − 3x draws itself, a yellow tangent slides along it while the derivative is traced in a linked plot below, then the equation transforms term by term into 3(x − 1)(x + 1) and the turning points light up at x = −1 and 1.
Written and rendered by AI CSS Animations Oct 16, 2026
- Type
- prompt
- Made with
- Claude Opus 5.5 in Claude Code
- Built in
- SVG
- Topics
- Explainer · Charts
About this style
Animated math explainers build an idea on a dark canvas one step at a time: exact curves, labels in a mathematical serif, and equations whose terms visibly travel from line to line. The style grew on video platforms in the 2010s, and the open-source Python library Manim, first written for one such channel, made it widely reproducible. Its rules come from teaching: one idea at a time, linked views, and every animated change mirroring a real algebraic or geometric step.
The prompt
Make a 10-second math explainer on a dark ground: a cubic draws itself, a tangent slides along it while its slope is traced below as the derivative, and the derivative's equation transforms step by step until the turning points fall out.

<inputs>
- Function: f(x) = x³ − 3x, shown for −2.1 ≤ x ≤ 2.1.
- Title: "Where does the slope hit zero?"
- Derivative steps and notes: f′(x) = 3x² − 3 ("power rule") → f′(x) = 3(x² − 1) ("factor out 3") → f′(x) = 3(x − 1)(x + 1) ("difference of squares").
- Result line: "f′(x) = 0 at x = −1 and x = 1". Caption: "Flat tangent, turning point."
- Length: 10 seconds.
If I don't give you something, use the default and don't ask.
</inputs>

<direction>
Palette: ground #17181C; axes and ticks #8E929C at 2px; unit grid #24262C at 1px; text #ECEDEF; notes and readout #9A9EA8. Curve f #5CC8E8 at 4px; derivative f′ #8BD17C at 4px; tangent #FFD25A at 3px with a 10px dot at the contact point; zeros and the result #FF6B5E.
Type: math in "STIX Two Text": variables italic; digits, operators and brackets upright; a true minus (−) and prime (′); 46px in the equation column (the result line 40px), 22px for tick numbers; superscripts at 62% size, raised 0.42em. Title "STIX Two Text" 600, 54px. Notes and the live readout in "Fira Code" 400, 22px.
Layout: two stacked plots on the left share one x scale: x from −2.1 to 2.1 maps to stage x 140–1140 (238.1px per unit). The top plot (f) spans y 200–580 for −3.2 ≤ y ≤ 3.2 (59.4px per unit), its x-axis at y 390. The bottom plot (f′) spans y 640–980 for −4 ≤ y ≤ 11 (22.67px per unit), its x-axis at y 889.3. Ticks every unit on x and on the top y-axis, every 5 on the bottom y-axis; arrowheads at the positive ends; plot labels "f(x)" and "f′(x)" in their curve colors at each plot's top-left. Title top-left at x 140, baseline y 120. Equation column from x 1240 to 1830: line 1 at baseline y 300, line 2 at y 430 with its note 44px beneath, the result at y 580, the caption at y 680 (italic, 30px). Readout "x = −1.50   slope = 3.75" right-aligned at x 1140, baseline y 618.
Exactness: sample every curve at 400 or more points. The tangent is the true line through (x₀, f(x₀)) with slope f′(x₀), 420px long and centered on the point, its screen direction accounting for the two axis scales, clipped to the top plot. A dashed 1.5px #6A6E78 vertical joins the contact point to the derivative dot at (x₀, f′(x₀)) below; f′ is drawn only from where the sweep began up to x₀. As x₀ crosses −1 and 1, a red dot lands on f′'s zero and stays.
Transforms: typeset each line as tokens, each its own SVG text, positioned from widths measured after the fonts load. Between steps, tokens that persist travel to their new places on gentle arcs over 0.7s on cubic-bezier(0.65, 0, 0.35, 1); tokens that leave fade out drifting 12px down; new ones fade in from 12px above. In the first step a copy of line 1 drops to line 2 and becomes the derivative: the exponent 3 of x³ slides down in front as the coefficient, a new exponent 2 fades in, and the x of 3x fades out, leaving −3. The factoring steps move the 3 out front and split x² into the two brackets.
Motion: everything that appears is drawn: axes grow from their origins (0.5s, easeOutCubic), curves draw left to right via stroke-dashoffset (1.0s, easeInOutCubic), text writes on with a left-to-right clip (0.5s). The tangent sweep runs on easeInOutSine. One idea at a time; nothing bounces.
The real thing is exact and patient: a tangent that truly touches, two plots on one x scale, terms that physically travel between lines. The cheap version crossfades equations, fakes the tangent and adds neon glow.
Banned: glow or bloom, gradients, chalkboard textures, handwriting fonts, crossfade-only equation changes, approximate curves, a tangent that leaves the curve, numbers that disagree with the math, 3D, emoji, anything flashing more than 3 times per second.
</direction>

<structure>
0.0–0.8s: the title writes on; line 1, "f(x) = x³ − 3x", writes on in the equation column.
0.8–1.4s: both sets of axes grow from their origins; tick numbers and plot labels fade in.
1.4–2.4s: the curve f draws left to right.
2.4–2.8s: the tangent grows out from its contact point at x₀ = −2.0; the derivative dot and the dashed connector appear below.
2.8–5.6s: x₀ sweeps from −2.0 to 2.0; f′ traces behind the dot; the readout updates live to two decimals; red dots land at x = −1 and x = 1 as the tangent passes flat.
5.6–6.4s: the copy of line 1 drops to line 2 and transforms into "f′(x) = 3x² − 3"; its note writes on.
6.4–7.1s: line 2 transforms into "f′(x) = 3(x² − 1)"; its note changes.
7.1–7.8s: line 2 transforms into "f′(x) = 3(x − 1)(x + 1)"; meanwhile x₀ eases back from 2.0 to 1.0 (easeInOutCubic) and parks with the tangent flat.
7.8–8.6s: red dashed guides draw down through both plots at x = −1 and x = 1; red dots mark the turning points (−1, 2) and (1, −2); the result line writes on in red; the caption writes on.
8.6–10.0s: hold, perfectly still.
Other lengths: stretch the sweep and the holds first; never transform an equation in under 0.5s.
</structure>

<build>
One self-contained index.html, CSS and JS inline. Google Fonts via <link> are fine; no other libraries. Draw in inline SVG whose attributes seek sets directly; no canvas or three.js needed. Await document.fonts.load() for every face before defining window.seek. The stage is 1920×1080 (16:9), scaled to fit the window. Design for 60fps. window.seek(t), t in seconds, must compute every visual from t alone: no CSS transitions or animations, no setTimeout or setInterval, no state carried between frames, and randomness only from a seeded PRNG. Without ?render in the URL, drive seek from requestAnimationFrame so it plays in a browser (loop after a 1s end hold); with ?render, don't start that loop.
</build>

<check>
Before showing me, step through one frame per second: screenshot each and look at it. Fix overlaps, clipped or cramped text, accidental edge collisions, and anything off-style or Banned. On several frames, compare the tangent's height at x₀ with f(x₀) and its slope with f′(x₀); check the readout matches the dot below, the red markers sit exactly on x = −1 and 1, every transform moves tokens instead of crossfading, and nothing in the equation column overlaps. Confirm seek(duration) and seek(duration + 1) match, so the final frame holds.
</check>
Ours, and free to use under CC0: copy it, change it, ship it. No credit needed.
Similar prompts
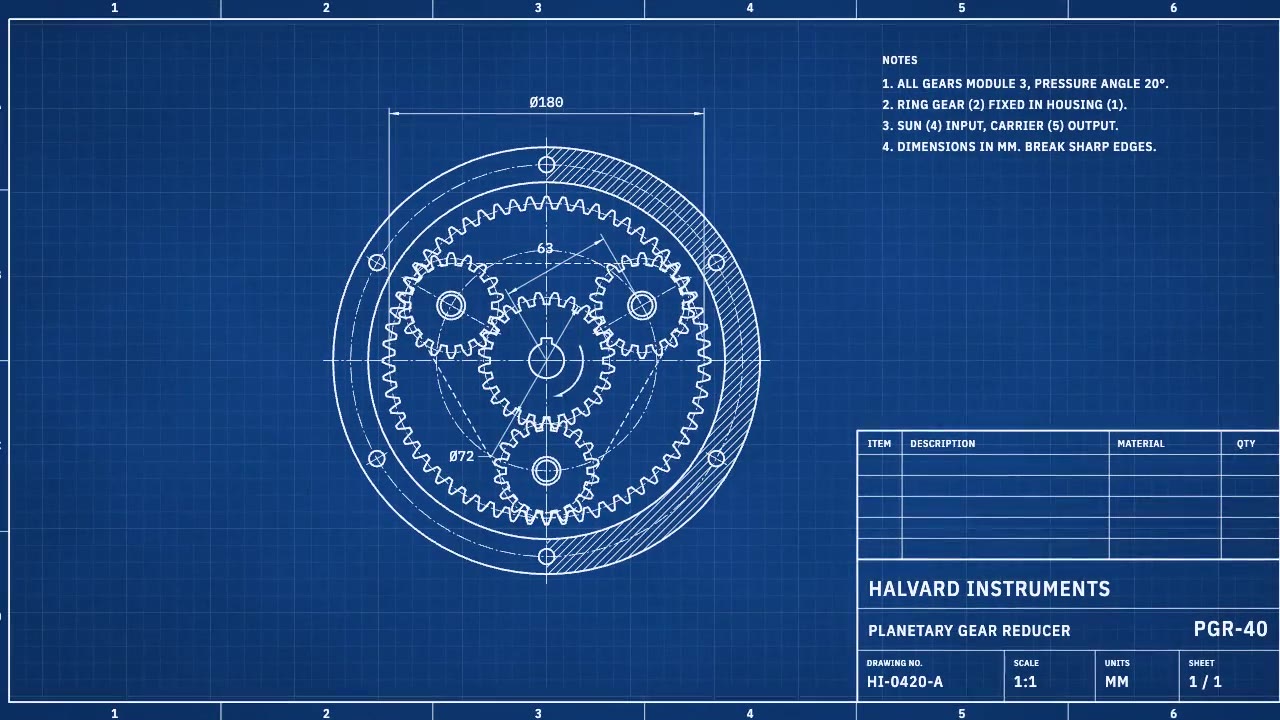
A cyanotype-blue engineering sheet that drafts itself: centerlines, compass-swept gears, hatching and dimension lines a…

A recipe app demonstrates Material-style motion: a card expands into a full screen, tabs switch on a shared axis, a FAB…
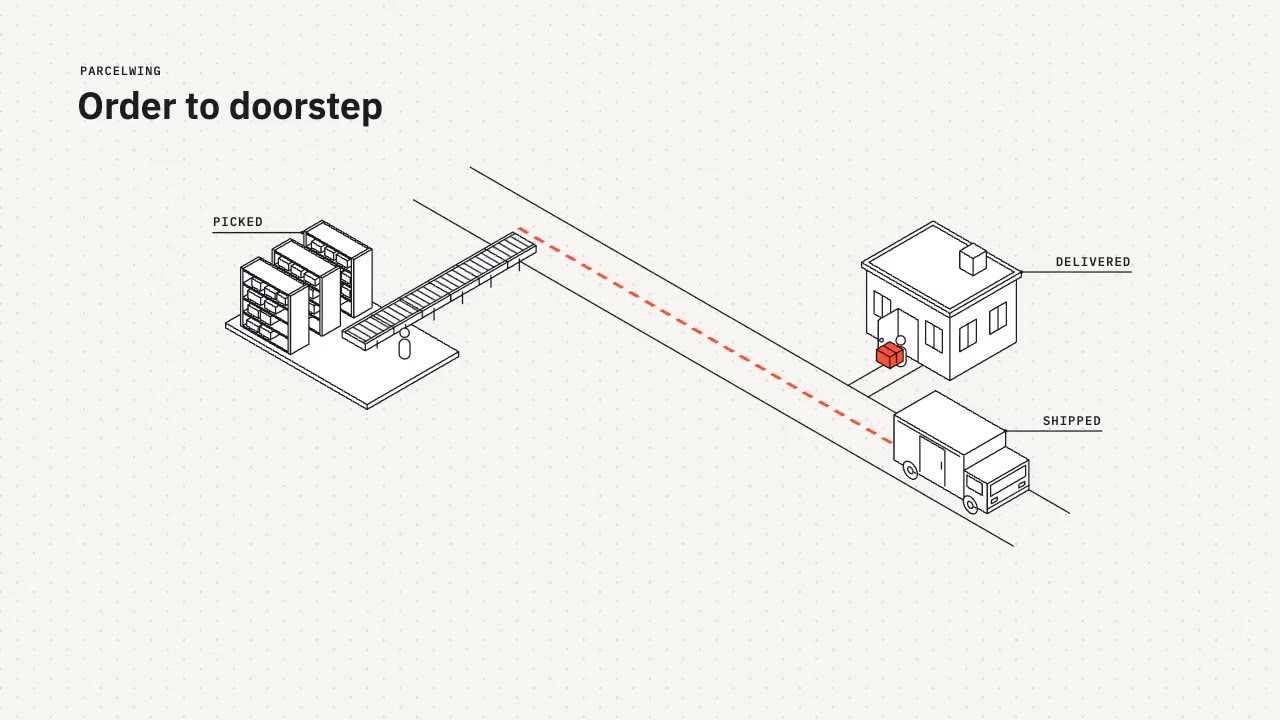
A tidy isometric line-art explainer: constant 2px strokes, white faces and one vermilion accent as a parcel travels fro…

A bright, rounded science explainer on a deep-space backdrop: springy geometric shapes, two-tone shading and soft long…
More like this on the motion design inspiration board: Explainer video inspirationData visualization inspiration