
Isochrone Map
Teal travel-time bands spread from a square across a fictional city map: they race out along two coral tram lines, squeeze through three bridges, open an island around a far rail station, and a residents counter rolls up to 214,000 as each five-minute band completes.
Written and rendered by AI CSS Animations Oct 18, 2026
- Type
- prompt
- Made with
- Claude Opus 5.5 in Claude Code
- Built in
- Canvas
- Topics
- Maps · Charts
About this style
An isochrone map shades the places that can be reached from one point within equal steps of travel time. Francis Galton published an isochronic chart of travel times from London to the rest of the world in 1881. Because the bands follow real routes, they stretch along fast transit lines, pinch at rivers and bridges and form islands around distant stations instead of making circles. Urban planners, transit agencies, property sites and delivery services use them to show access at a glance.
The prompt
Make a 10-second animated isochrone map: travel-time bands spread from one square across a fictional city, racing out along tram lines, squeezing through bridges and opening an island around a far rail station.

<inputs>
If I don't give you something, use the default and don't ask.
- City: Esterholt (fictional). Origin: Tolhurst Square.
- Kicker: "ACCESS STUDY 04"
- Title: "Within 30 minutes"
- Subtitle: "of Tolhurst Square on foot, by tram and by rail, weekdays at 9:00"
- Bands: every 5 minutes up to 30. Residents first reached in each band: 0–5 min 18,000 · 5–10 31,000 · 10–15 42,000 · 15–20 47,000 · 20–25 41,000 · 25–30 35,000 (214,000 in all).
- Callout: "Holm Park: 12 minutes by rail"
- Length: 10 seconds.
</inputs>

<direction>
- Palette: land #ECEAE4, city blocks #E1DED6, streets #FFFFFF, river #B8D1DB with a #93B3C1 bank line, park #D3E0C8, rail #6F6B65. The one accent is coral #EE5A3C, for the tram lines and the origin. Bands run dark to light as time grows: 0–5 #0D5C5D, 5–10 #1F7C78, 10–15 #3A9990, 15–20 #67B5A6, 20–25 #9DCFBD, 25–30 #CDE7D9. Text ink #1C2A2E, secondary #5B696C.
- The city, generated once at load from a seeded PRNG: a river entering at (760, 0) and leaving at (1240, 1080) in two soft meanders, 70–90px wide, crossed by three bridges at y 250, 640 (the tram bridge) and 900; an old town around the origin on a block grid rotated 8° (blocks 60–90px) and a newer grid rotated −4° beyond it (blocks 90–130px); three curving avenues 9px wide; minor streets 3px; Holm Park, a park around (1700, 200).
- Scale: 1px is 5 m. Walking covers 80 m a minute (16 px/min) on streets and 25% less across blocks, so fronts run ahead along the street grid and their edges carry its fine sawtooth. Water can only be crossed on a bridge.
- Transit: the origin sits at (1280, 520). Tram A runs west to east from (680, 700) over the tram bridge, through the origin and on to (1860, 420); tram B runs north to south from (1250, 80) through the origin to (1390, 1010). Stops every 120px (600 m); trams cover 64 px/min; boarding costs a 3-minute wait, getting off is free. One rail line runs from the origin to Holm Park station at (1700, 220): a 4-minute wait and an 8-minute ride, so the station is first reached at 12 minutes. Tram lines are 5px coral with white-ringed stop dots; the rail is a 4px line with 2px cross-ticks every 24px.
- Travel time: at load, run Dijkstra over a 4px grid (8 neighbours, diagonals cost ×√2), with stops and the station as extra nodes linked to their cells, giving T(x, y) in minutes; blur T 3×3 over land so edges aren't grid-stepped. Bands, fronts and labels all come from this one field. Nothing is a circle.
- Drawing: the basemap on a 2D canvas, once. The bands on one WebGL2 canvas laid over it with CSS mix-blend-mode: multiply: T uploads once as an R32F texture (sample it with manual bilinear filtering, since float textures may not filter); for the front minute M(t), a pixel takes its band's color at 82% where T ≤ M, its edge anti-aliased by smoothstep over fwidth(T). Above that, a 2D canvas redraws the streets in white at 30% so the city reads through the bands, then a crisp 2.5px white front line (the T = M contour, by marching squares) and 1px #0D5C5D lines on every completed 5-minute boundary.
- Origin: a 22px coral disc with a 4px white ring and, while the front runs, one soft halo every 2 s (a ring growing to 70px as it fades).
- Panel: a card at x 96–656, y 96–984, #FBFAF7 at 94% with a 1px #D6D2C9 edge, 16px corners and 48px padding. In it: the kicker in "Spline Sans Mono" 500, 20px, tracked 0.12em, coral; the title in "Instrument Sans" 700, 64px; the subtitle in Instrument Sans 400, 26px, secondary, three lines at most; a legend of six rows (a 36×28px swatch, the band in Spline Sans Mono 500, 22px, and its residents right-aligned at 22px); "Residents within reach" in Instrument Sans 600, 22px, over the running total in Spline Sans Mono 600, 60px, tabular figures; at the foot, a 0–1 km scale bar (200px) and "Modeled travel times. Fictional city." at 20px, secondary.
- Map labels: Old Quay, Northgate, Holm Park, Tannery Row and Eastbank in Instrument Sans 600, 20px, uppercase, tracked 0.12em, secondary, each with a 3px land-colored halo; "River Ommer" in Instrument Sans 500 italic, 22px, #5E8796, along its curve; "Tolhurst Square" in Instrument Sans 700, 24px, beside the origin.
- Motion is a calm instrument: M(t) climbs from 0 to 30 on cubic-bezier(0.45, 0, 0.55, 1) and never steps; entrances rise 12px as they fade in over 0.5 s on cubic-bezier(0.22, 1, 0.36, 1); lines draw outward from the origin by dash offset over 0.6 s. As M passes each band's upper bound, that legend row's swatch fills and its residents add to the total with a 0.35 s odometer roll, so the total lands exactly on 214,000.
- Premium: bands that stretch along tram lines in beads around the stops, pinch at bridges and leave an island around a far station, because they come from real travel times, over a basemap you can still read. Cheap: concentric rings around a pin on a grey grid.
Banned: circles or buffer rings, rainbow ramps, glow, 3D tilt, teardrop pins, map libraries or real map data, bands crossing water anywhere but a bridge, a front that jumps in steps, anything flashing more than 3 times per second.
</direction>

<structure>
- 0.0–1.0s: the basemap fades up, water and park first, then the streets; the panel rises with its kicker, title and subtitle.
- 1.0–1.6s: the origin drops in; the tram lines and the rail draw outward from it; stops pop on 30ms apart; the legend rows appear empty with the total at 0.
- 1.6–7.0s: the front runs from 0 to 30 minutes: slowly on foot at first, then streaking out along both tram lines in beads around each stop, squeezing through the bridges and fanning out on the far bank. At 12 minutes an island opens around Holm Park station and grows until it joins the main area. Each legend row fills as its band completes.
- 7.0–7.8s: the front line settles into the 30-minute boundary; "10 min", "20 min" and "30 min" set along their boundaries in Spline Sans Mono 500, 20px, rotated to the line with a knocked-out gap behind each, on smooth stretches clear of the tram lines.
- 7.8–8.6s: the callout attaches to the island on a 1px ink leader ending in a 5px dot.
- 8.6–10.0s: hold, completely still.
For other lengths, stretch the front's run; keep at least 1 s of hold.
</structure>

<build>
- One self-contained index.html (inline CSS and JS), a 1920×1080 (16:9) stage scaled to fit the window, designed for 60fps. No image, video, texture or model files: every shape and texture is generated in code.
- window.seek(t), t in seconds, computes every visual from t alone: no CSS transitions or CSS animations, no setTimeout/setInterval, no state carried between frames, randomness only from a seeded PRNG. Anything cumulative is solved analytically from t or precomputed once at load at a fixed step. Past the end, seek clamps to the last frame.
- Without ?render in the URL, drive seek from requestAnimationFrame so it plays in a browser (loop after a 1s end hold); with ?render, don't start that loop.
- Google Fonts via <link> are fine; await document.fonts.load() for each face before defining window.seek.
- Engine: Canvas: the basemap and the overlay on 2D canvases, the bands on one WebGL2 canvas (preserveDrawingBuffer: true, drawn once per seek), every backing store sized from CSS size × devicePixelRatio. No map or chart libraries. Canvas won't fetch fonts itself, so the awaited loads matter.
- The city and the travel-time field are built once at load from the seeded PRNG (keep it under 5 s); seek(t) only sets M(t) and redraws, and the total is a sum over the bands completed by t.
</build>

<check>
Before showing me, step through one frame per second (t = 0…10): screenshot each and look at it. Fix overlaps, clipped or cramped text, and anything off-style or Banned. Check the bands cross the river only at bridges, beads show around tram stops, the island appears at 12 minutes, no band edge reads as a circle, the streets stay readable through the bands at 6 s and in the final frame, and the total lands on 214,000. Confirm seek(10) and seek(11) match, so the final frame holds.
</check>
Ours, and free to use under CC0: copy it, change it, ship it. No credit needed.
Similar prompts
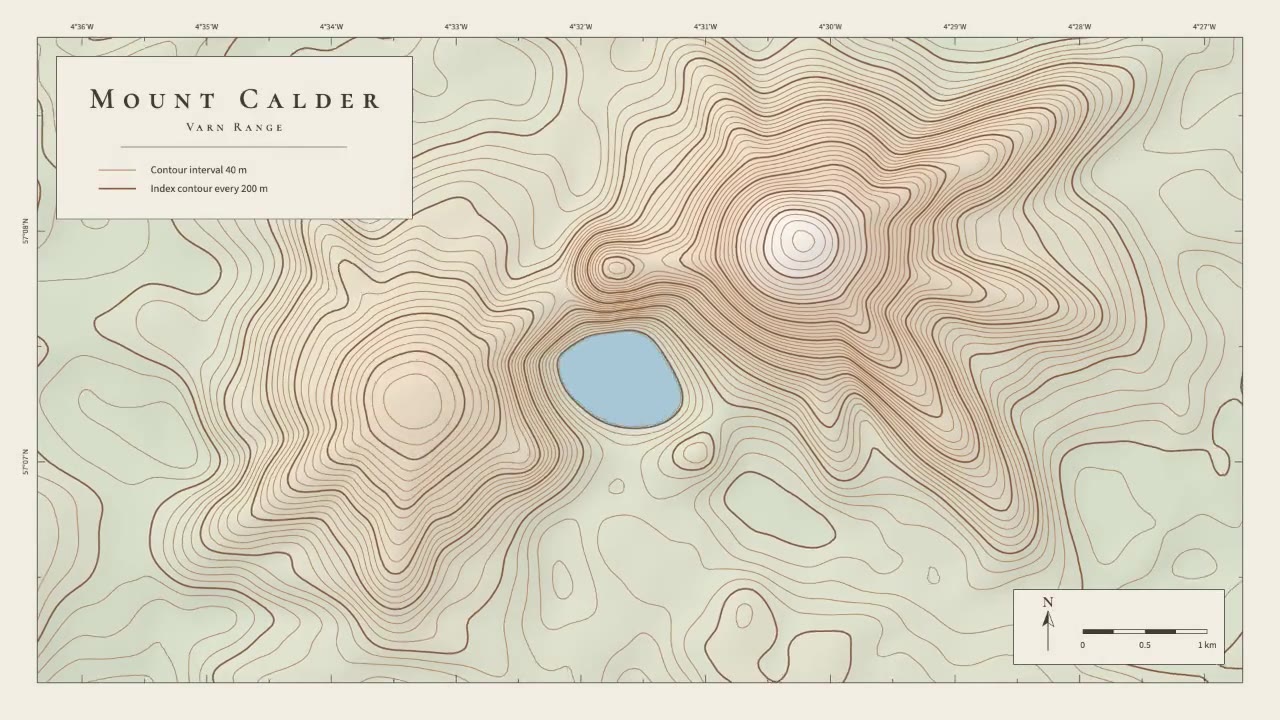
A calm cartographic animation: smooth brown contour lines draw in from valley to summit, the terrain slowly morphs as a…
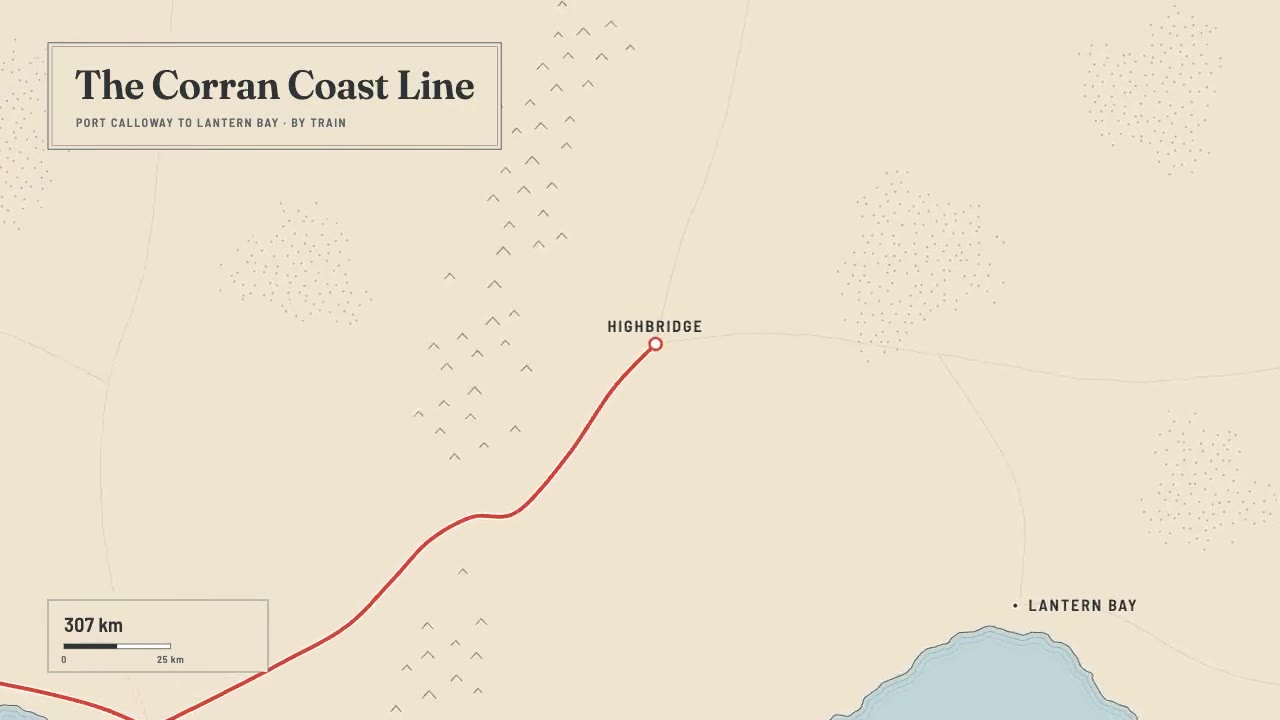
A print-style travel map that draws itself: water-lined coast, ink mountains and serif labels, then a red route line ca…
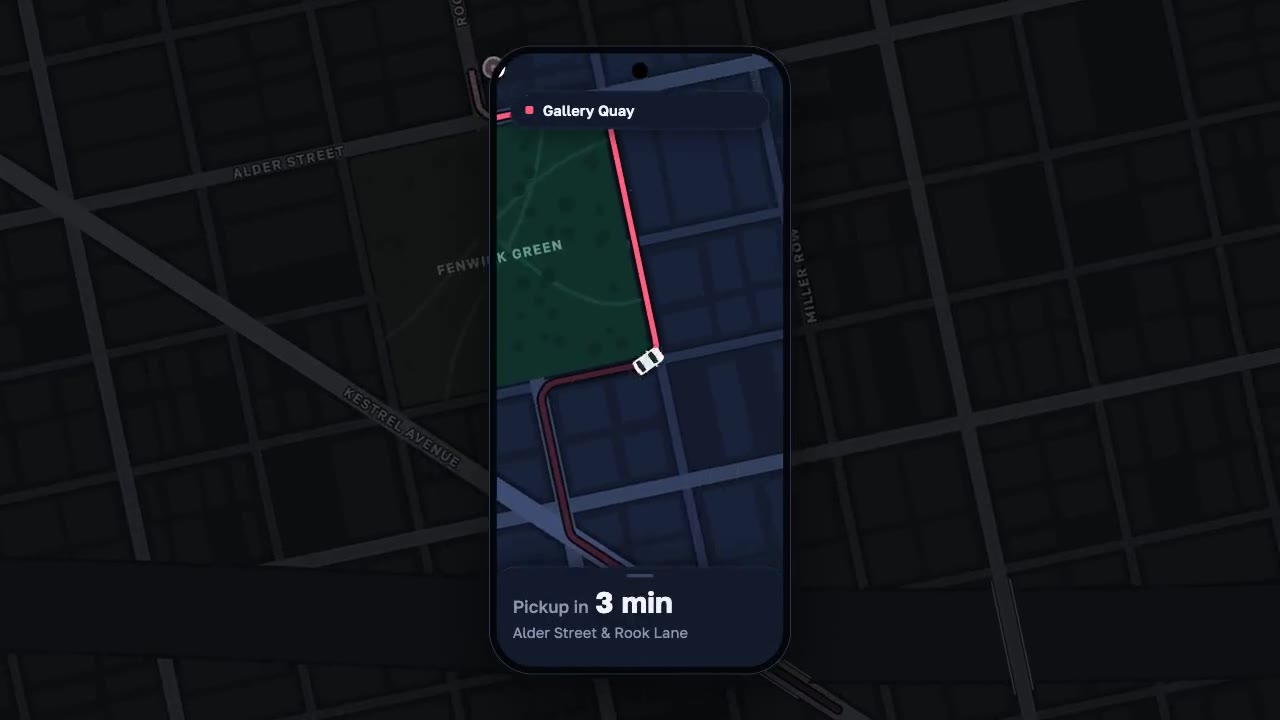
A night map seen through a phone that works like a lens, the city dimmed around it: a coral route draws along procedura…
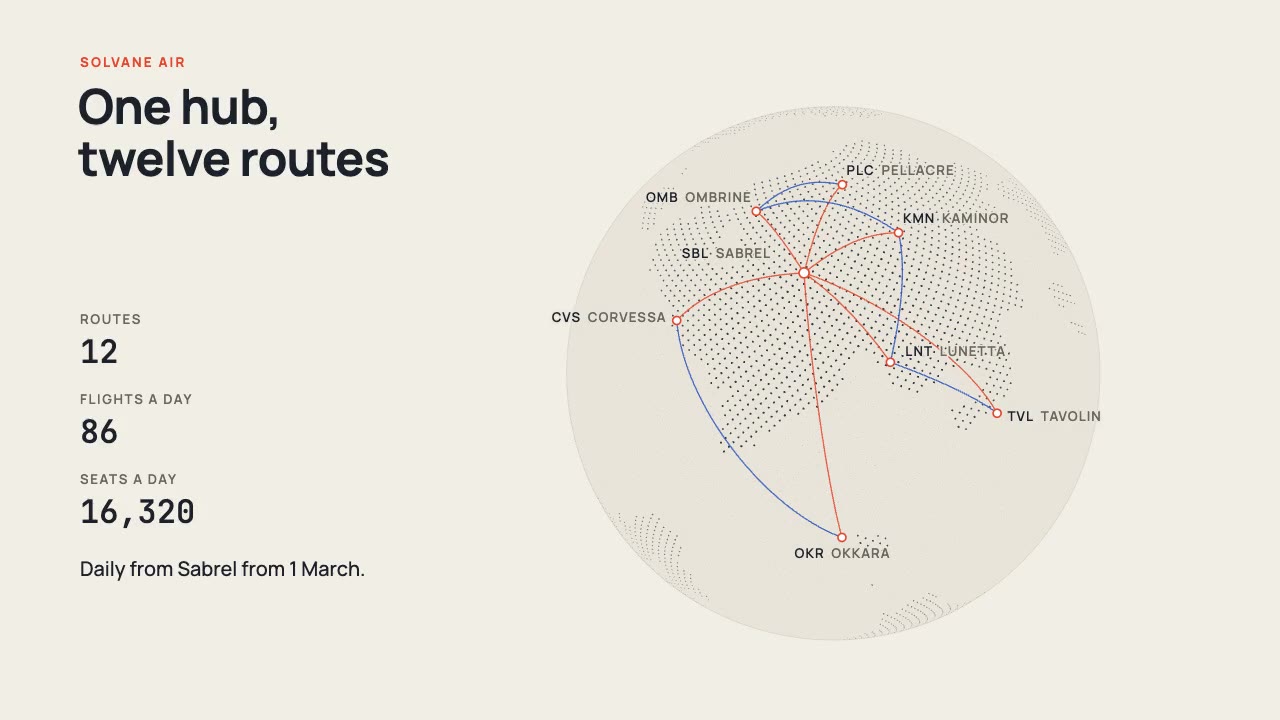
A print-style dotted globe of a fictional world turns on warm paper while vermilion and cobalt arcs fly a new airline's…
More like this on the motion design inspiration board: Data visualization inspirationMap animation inspiration