
Compound Interest
On a sunflower-yellow poster, thirty yearly bars stack deposits in black, interest in cream and interest on interest in tomato while the axis rescales to fit, a curve bends upward and a ledger rolls to $36,000 + $33,480 + $31,082 = $100,562.
Written and rendered by AI CSS Animations Oct 18, 2026
- Type
- prompt
- Made with
- Claude Opus 5.5 in Claude Code
- Built in
- HTML/CSS
- Topics
- Explainer · Charts
About this style
Compound interest adds each period's interest to the balance, so later interest is paid on earlier interest as well as on the money put in. Luca Pacioli's Summa de arithmetica of 1494 already gives the rule of 72 for estimating how long money takes to double, and Jacob Bernoulli's study of ever more frequent compounding in 1683 led toward the constant e. Banks, pension providers and personal-finance teachers explain it with stacked bars that split a balance into deposits and interest, because the widening top band shows the effect better than a formula.
The prompt
Make a 10-second savings explainer about compound interest: a deposit stacks up every year, interest starts earning interest, and 30 bars bend into a curve, with a ledger that adds up to the dollar.

<inputs>
If I don't give you something, use the default and don't ask.
- Series: Wrenfield Savings · Money Basics (fictional).
- Title: "Interest that earns interest"
- Plan: $1,200 deposited at the start of each year for 30 years, earning 6% a year, compounded yearly.
- Callouts: "Year 2: just $4 of interest on interest" · "Year 12: the interest ($1,215) beats the deposit ($1,200)" · "Year 30: almost a third of the balance is interest on interest"
- Footnote: "Illustration only. No fees, taxes or inflation."
- Length: 10 seconds.
</inputs>

<direction>
- Look: a bold printed money poster rather than a dashboard: one sunflower ground, black ink, two inks for interest, big serif numbers, nothing glossy.
- Palette: ground #F4C542; ink #17140F; cream #FFF4D6; tomato #E24A2D; secondary #5A4813; gridlines ink at 16%.
- Type: Instrument Serif 400 for the title (84px, with "earns" in italic) and the balance (72px); Instrument Sans 500 and 700 for labels, the plan line and callouts, 22–28px; Spline Sans Mono 500 for every running figure, so digits never jitter. Kicker "WRENFIELD SAVINGS · MONEY BASICS" in Instrument Sans 700, 20px, tracked 0.14em, above the title at (120, 96); the plan line in Instrument Sans 500, 26px, beneath the title.
- Math, exact: balance B(n) = (B(n − 1) + 1,200) × 1.06, with B(0) = 0. Each year-end balance splits three ways: deposits D(n) = 1,200n; interest on deposits S(n) = 72 × n(n + 1) ÷ 2 (6% on each deposit for every year it has sat there); interest on interest Z(n) = round(B(n)) − D(n) − S(n). Year 2: $2,620 = $2,400 + $216 + $4. Year 12: $21,459, and that year's interest is $1,214.64. Year 30: $100,562 = $36,000 + $33,480 + $31,082.
- Chart: a plot from x 140 to 1360 with its baseline at y 900 and its top at y 380. Thirty bars 30px wide on a 41px pitch, each a stack: deposits in ink at the bottom, interest on deposits in cream above, interest on interest in tomato on top, separated by 2px ground-colored gaps. Year labels under bars 1, 5, 10, 15, 20, 25 and 30 in Instrument Sans 500, 20px. A 4px ink curve threads through the bar tops as each bar lands; a 2px dashed ink line marks deposits alone, so the gap between them is all interest.
- The y-axis rescales honestly instead of breaking: its top is 1.15 × the tallest bar so far (never less than $3,000), and every bar's height follows that scale as it grows, so early bars shrink as later ones arrive. Gridlines sit at round values from the 1-2-5 series, four to six in view, labelled in Spline Sans Mono 20px just above each line at the left ("$20,000"); when the step changes, the old lines fade out as the new ones fade in over 0.3s of axis growth.
- Ledger at x 1440–1800 from y 380: "Year 0" in Spline Sans Mono 28px; three rows, each a 20px swatch, a label in Instrument Sans 600, 24px, and a figure in Spline Sans Mono 500, 34px, right-aligned at x 1800: Deposits, Interest on deposits, Interest on interest; a 2px ink rule; then Balance in Instrument Serif, 72px. Figures roll like an odometer (digits slide vertically over 0.2s) and always sum to the balance shown.
- Callouts sit in parts of the plot that are empty at that moment, in Instrument Sans 600, 24px, each on a 1px ink leader ending in a 5px dot that rides its bar as the axis rescales: year 2's to the right of bar 3 at about (300, 520), shown 1.7–2.6s; year 12's in the plot's upper left (x 160–620, y 400–470) from 5.0s, once the axis has grown enough to clear the early bars; year 30's in two lines at x 700–1200, y 400–470, with a bracket beside bar 30 spanning its tomato block, labelled $31,082.
- Motion: each year the deposit block drops into its bar from 60px above over 0.25s on cubic-bezier(0.3, 0, 0.1, 1) with a 3% squash on landing, then the two interest blocks grow up from it over 0.25s on cubic-bezier(0.22, 1, 0.36, 1). Years 1–3 land 0.5s apart; years 4–30 accelerate, their spacing shrinking evenly from 0.22s to 0.06s, so the growth itself feels like it is picking up speed. Callouts rise 12px as they fade in over 0.4s.
- Premium: a ledger you could audit: every bar splits exactly into its three parts, the axis rescales instead of cheating, every figure is to the dollar. Cheap: a rocket arrow, coins and dollar signs, a curve with no numbers.
Banned: coins, piggy banks, dollar-sign icons, falling money, rocket or hockey-stick arrows, 3D bars, gradients, drop shadows, a broken or truncated y-axis, figures that don't add up, promises of returns, anything flashing more than 3 times per second.
</direction>

<structure>
- 0.0–1.2s: the ground; the kicker, title and plan line rise in; the baseline draws left to right and the empty ledger sets in at zero.
- 1.2–2.9s: years 1–3 land slowly (1.4, 1.9 and 2.4s) on a $3,000 axis; the year-2 callout points at the hairline tomato sliver on bar 2.
- 2.9–6.6s: years 4–30 land faster and faster while the axis grows to fit; the curve bends upward; the year-12 callout appears at 5.0s and stays.
- 6.6–7.6s: the axis settles at its final scale; the year-30 callout and its bracket appear.
- 7.6–8.6s: the ledger rests on $36,000 + $33,480 + $31,082 = $100,562; the footnote fades in at bottom-left (120, 1000) in Instrument Sans 400, 20px.
- 8.6–10.0s: hold, nothing moving.
For other lengths, stretch the accelerating run; keep years 1–3 slow and at least 1s of hold.
</structure>

<build>
- One self-contained index.html (inline CSS and JS), a 1920×1080 (16:9) stage scaled to fit the window, designed for 60fps. No image, video, texture or model files: every shape and texture is generated in code.
- window.seek(t), t in seconds, computes every visual from t alone: no CSS transitions or CSS animations, no setTimeout/setInterval, no state carried between frames, randomness only from a seeded PRNG. Anything cumulative is solved analytically from t or precomputed once at load at a fixed step. Past the end, seek clamps to the last frame.
- Without ?render in the URL, drive seek from requestAnimationFrame so it plays in a browser (loop after a 1s end hold); with ?render, don't start that loop.
- Google Fonts via <link> are fine; await document.fonts.load() for each face before defining window.seek.
- Engine: absolutely positioned HTML elements, setting transforms, clip-paths and opacity from seek; no other libraries (no three.js: this style is flat).
- Bars, gridlines, labels and the ledger are HTML; the curve and the deposits line are one inline SVG over the plot, recomputed each seek from the current scale.
- Compute B(n), D(n), S(n) and Z(n) once at load in full precision and round only for display; each bar's landing time, the axis top and every figure are functions of t read from that table.
</build>

<check>
Before showing me, step through one frame per second (t = 0…10): screenshot each and look at it. Fix overlaps, clipped or cramped text, and anything off-style or Banned. Check the ledger adds up in every frame, year 30 reads $36,000 + $33,480 + $31,082 = $100,562, the year-12 callout matches the bar it points at, gridline labels stay crisp and never pile up while the axis rescales, and no callout overlaps a bar or the curve. Confirm seek(10) and seek(11) match, so the final frame holds.
</check>
Ours, and free to use under CC0: copy it, change it, ship it. No credit needed.
Similar prompts
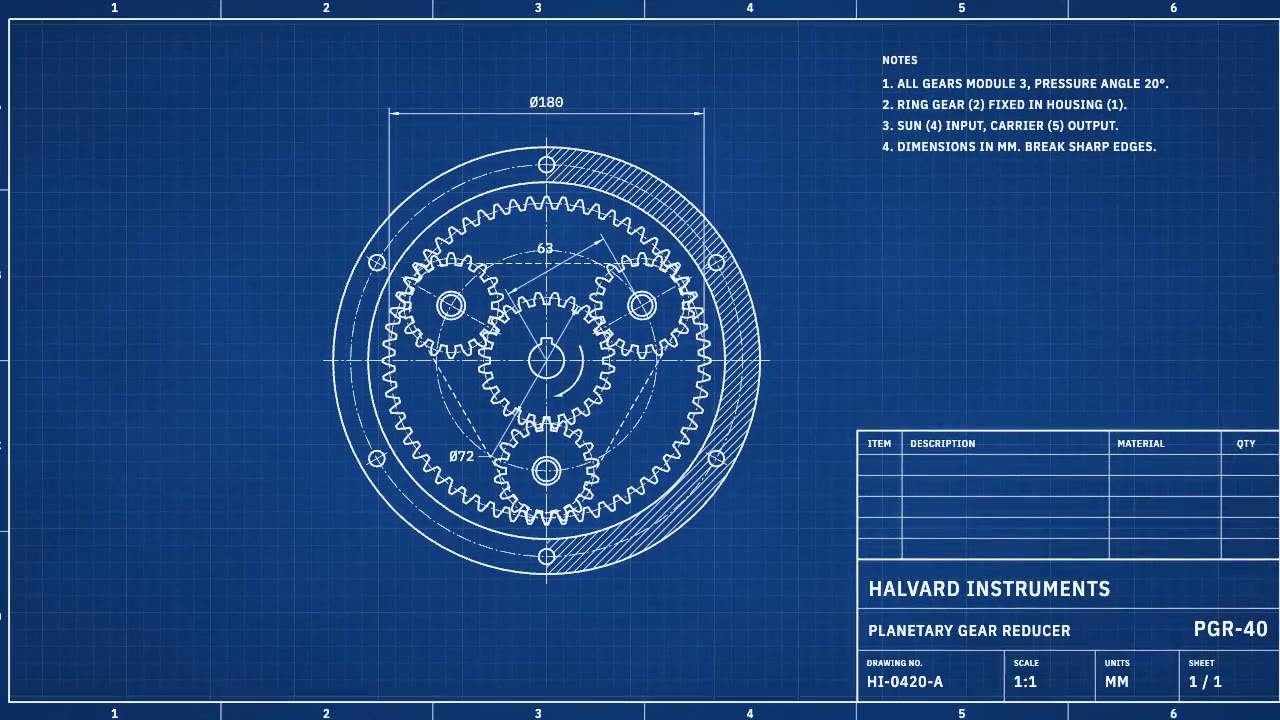
A cyanotype-blue engineering sheet that drafts itself: centerlines, compass-swept gears, hatching and dimension lines a…
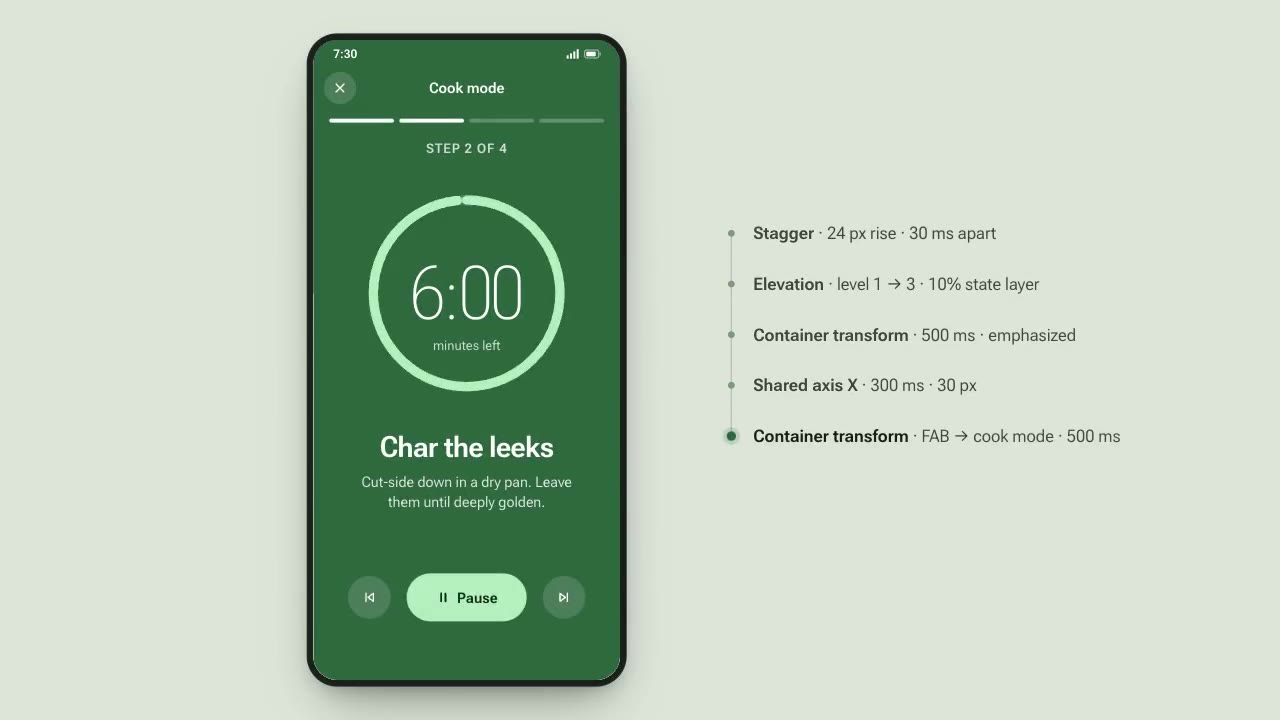
A recipe app demonstrates Material-style motion: a card expands into a full screen, tabs switch on a shared axis, a FAB…
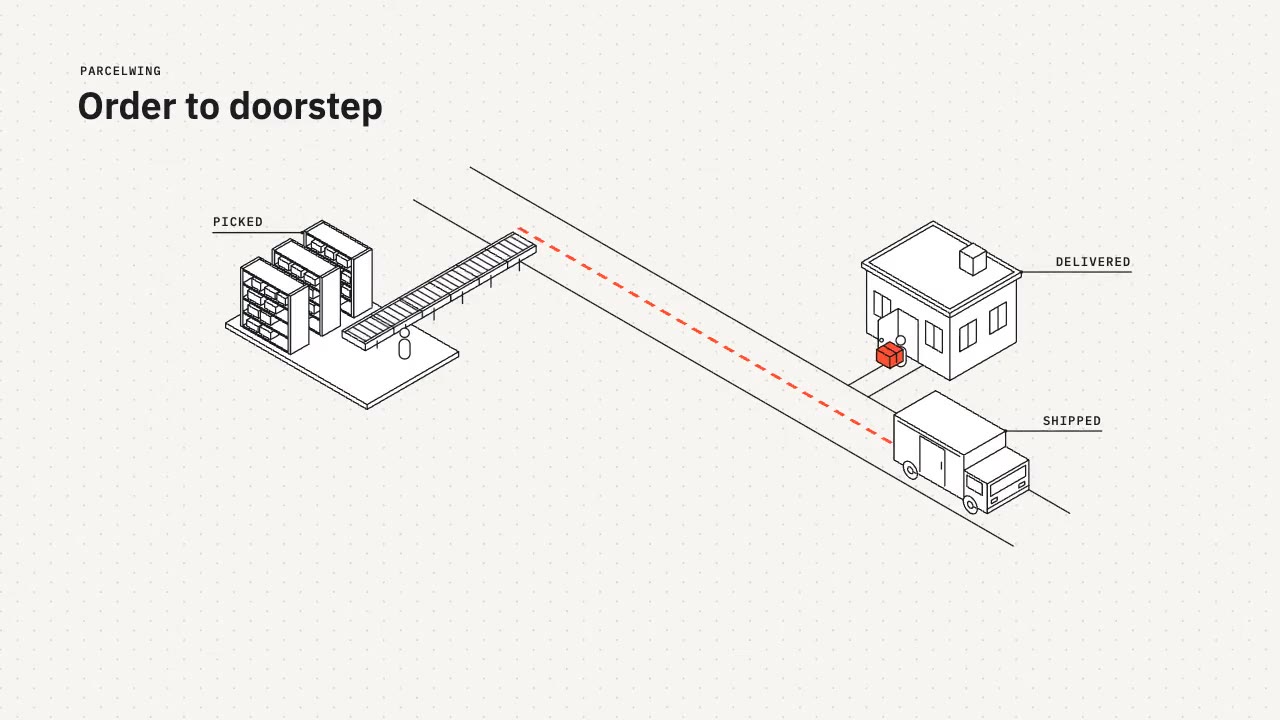
A tidy isometric line-art explainer: constant 2px strokes, white faces and one vermilion accent as a parcel travels fro…
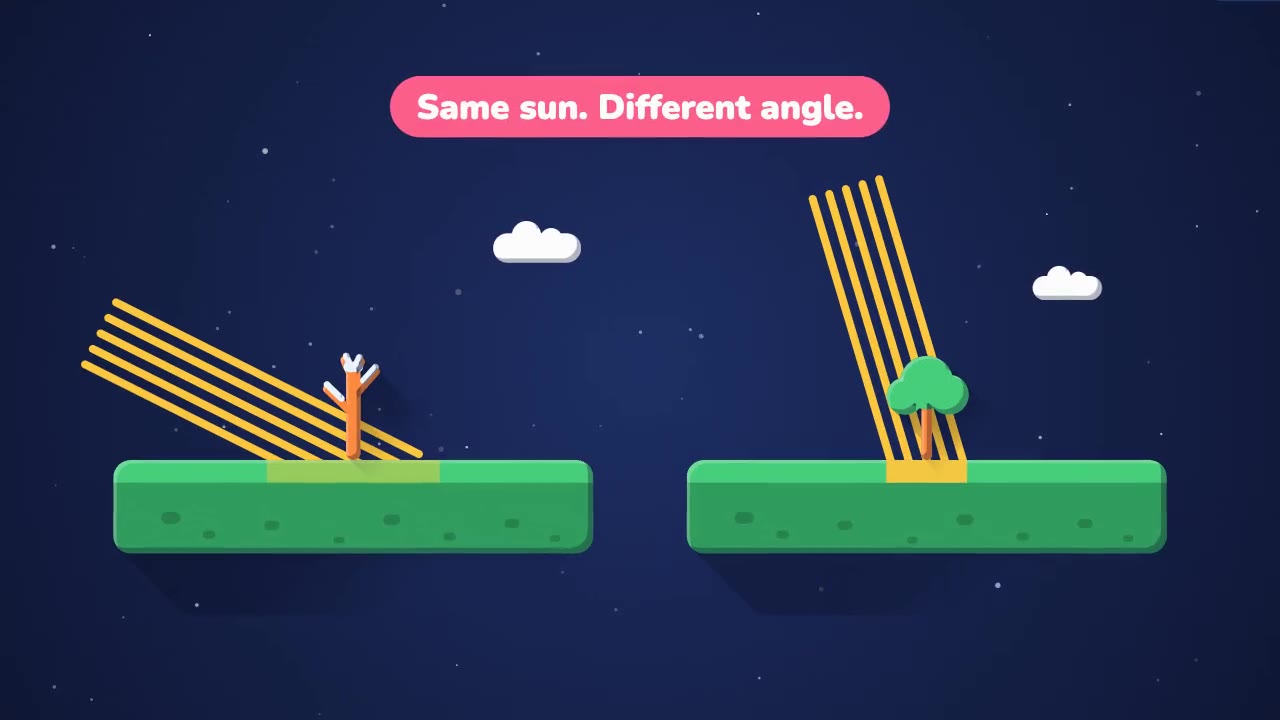
A bright, rounded science explainer on a deep-space backdrop: springy geometric shapes, two-tone shading and soft long…
More like this on the motion design inspiration board: Explainer video inspirationData visualization inspiration