
Vital Signs Monitor
A bedside patient monitor on black: a green ECG, cyan pleth and yellow respiration sweep left to right with erase bars, beat-matched numbers update, a blood pressure cycle counts down and lands, then the screen freezes.
Written and rendered by AI CSS Animations Oct 16, 2026
- Type
- prompt
- Made with
- Claude Opus 5.5 in Claude Code
- Built in
- Canvas
- Topics
- Charts
About this style
Bedside monitors show several physiological signals at once, each in its own color: the ECG, the pulse oximeter's plethysmograph wave, respiration and blood pressure, with large numbers beside them. The ECG is drawn as a sweep at the same 25 mm per second used for paper ECGs, with an erase bar moving ahead of the new trace instead of the whole line scrolling. Pulse oximetry grew from work by Japanese engineer Takuo Aoyagi in the 1970s. The look has become visual shorthand for medicine in film, television and health-tech branding.
The prompt
Make a 10-second bedside patient monitor animation: the ECG sweeps with an erase bar, the pleth and respiration waves follow beat for beat, and the numbers update like a real device.

<inputs>
- Monitor: Orrin VS-7 (fictional). Bed label: "BED 07 · ADULT".
- Readings: heart rate settling from 78 to 72 bpm; SpO2 97% rising to 98%; respiration 16 per minute; a blood pressure (NIBP) measurement during the clip, landing at 118/76 with a mean of 90; temperature 36.8 °C.
- Clock: 14:31, turning to 14:32.
- Length: 10 seconds.
If I don't give you something, use the default and don't ask.
</inputs>

<direction>
Palette: screen #000000; header and soft-key bars #11151A; dividers #1F262E; ECG #3DEB5C; pleth and SpO2 #2ED3F2; respiration #F5D33B; NIBP values #F2F2F2 with their label in #FF6B7A; temperature #E6E6E6; secondary text #7C8794. Each parameter keeps one color across its wave, label and number.
Type: Saira Semi Condensed 600 for numbers: HR 168px, SpO2 120px, RR 80px, NIBP 64px, temperature 48px. Saira 500 for labels and units, 22–26px, uppercase. Draw every number digit by digit in fixed-width cells so values never jitter.
Layout: header bar y 60–120 across x 96–1824 (wordmark, bed label, clock, a battery glyph). Waveform area x 96–1336: ECG lead II in y 150–430, pleth in y 460–640, respiration in y 670–850, each labeled at its top left ("II  ×1", "PLETH", "RESP"). Numeric column x 1376–1824, boxes from y 150 to 880 separated by 1px dividers: HR 220px tall, SpO2 160, RR 120, NIBP 130 (systolic/diastolic with the mean in brackets and the time it was taken), TEMP 100. Soft-key bar y 900–1000 with six keys: NIBP, FREEZE, ALARMS, TRENDS, PATIENT, MENU (24px).
The signals are physiology computed in code. Precompute beat times at load, from t = −5s, by integrating the heart rate (78 easing to 72 bpm by 5s) at a 1ms step, with respiratory sinus arrhythmia: beat intervals shorten about 3% during each inhale of the 16-per-minute breathing cycle. ECG: each beat is a sum of gaussians around its R peak (P +0.15 mV at −0.20s, Q −0.10 mV at −0.035s, R +1.20 mV at 0, S −0.28 mV at +0.035s, T +0.32 mV at +0.25s, with the T delay scaled by the square root of the beat interval), plus seeded baseline wander (±0.03 mV at 0.25 Hz) and fine noise (±0.008 mV); 1 mV is 110px. Pleth: a pulse 0.24s after each R peak, with a fast upstroke, a rounded peak, a dicrotic notch and a slow decay, its height modulated ±6% by breathing. Respiration: a smooth asymmetric wave at 16 per minute, inhaling for 40% of each cycle.
A sweep, not a scroll: the traces never slide. A write head moves left to right at 25 mm/s (200px/s, so a pass takes 6.2s) on all three channels; each pixel column shows the signal from the last time the head passed it, and a 24px black erase bar runs just ahead of the head. Lines are 2.5px, antialiased and sampled at every pixel column, with no glow.
Numbers behave like a device: HR is 60 divided by the mean of the last four beat intervals, updated at each R wave; SpO2 updates once per pulse; values change instantly and never tween or count. A small heart glyph beside HR brightens for 0.12s on each R wave. Pressing NIBP starts a cuff cycle: its box shows CUFF and a pressure falling from 168 mmHg in 3 mmHg steps every 0.2s until the result lands.
The real thing is clinical and quiet: waveforms that agree beat for beat, a true sweep with an erase gap, and numbers that match the traces. The cheap version is a glowing heartbeat line scrolling sideways next to a heart icon.
Banned: scrolling waveforms, glow or bloom, alarm banners, red flashing, flatlines or arrhythmias, heart clip-art, real manufacturers' names or screen layouts, numbers that disagree with the traces, anything flashing more than 3 times per second.
</direction>

<structure>
0.0–0.8s: black; the Orrin wordmark (Saira 600, 64px, #7C8794) fades up at the center, holds, and fades away.
0.8–1.6s: the screen builds: header and soft-key bars wipe in from the left (0.3s, cubic-bezier(0.22, 1, 0.36, 1)), dividers draw, labels appear 50ms apart, and the numeric boxes show dashes.
1.6s: all three write heads start at the left edge together; HR (78) and SpO2 (97) fill in at 1.8s, RR at 2.0s.
1.6–5.6s: the traces fill the screen; HR updates beat by beat, settling toward 72; SpO2 steps to 98 at about 4s; at 2.4s the NIBP key depresses (inverted for 0.2s) and the cuff countdown runs; at 5.6s NIBP lands as 118/76 (90) with the time 14:31.
5.6–7.8s: steady running; the clock turns to 14:32 at 7.0s; at 7.8s the write heads wrap to the left edge and begin erasing the first pass.
8.6–9.0s: the FREEZE key depresses and stays lit; every trace stops where it is, the numbers hold, and a FROZEN tag (22px, on #11151A) appears at the top of the waveform area.
9.0–10.0s: hold, frozen.
For other durations, keep the sweep at 25 mm/s, stretch the steady running, and keep the freeze for at least the last second.
</structure>

<build>
One self-contained index.html, CSS and JS inline. Google Fonts via <link> are fine; no other libraries (no three.js: this style is flat). Draw in Canvas 2D, repainting every frame from scratch, with the backing store sized from the CSS size × devicePixelRatio. Canvas won't fetch fonts itself: await document.fonts.load() for each face, then define window.seek. The stage is 1920×1080 (16:9), scaled to fit the window. Design for 60fps. window.seek(t), t in seconds, must compute every visual from t alone: no CSS transitions or animations, no setTimeout or setInterval, no state carried between frames, and randomness only from a seeded PRNG. Precompute the beat times, all three signals at 1ms resolution and every number's change times once at load; each trace column then reads the signal at the time the write head last passed it. Without ?render in the URL, drive seek from requestAnimationFrame so it plays in a browser (loop after a 1s end hold); with ?render, don't start that loop.
</build>

<check>
Before showing me, step through one frame per second: screenshot each and look at it. Fix overlaps, clipped or cramped text, accidental edge collisions, and anything off-style or Banned. Count the R waves in one full pass and confirm they match the HR shown; check every pleth peak trails its R wave by about 0.24s, the erase gap leads the write head on every channel, no trace ever slides sideways, and digits never shift. Confirm seek(duration) and seek(duration + 1) match, so the final frame holds.
</check>
Ours, and free to use under CC0: copy it, change it, ship it. No credit needed.
Similar prompts
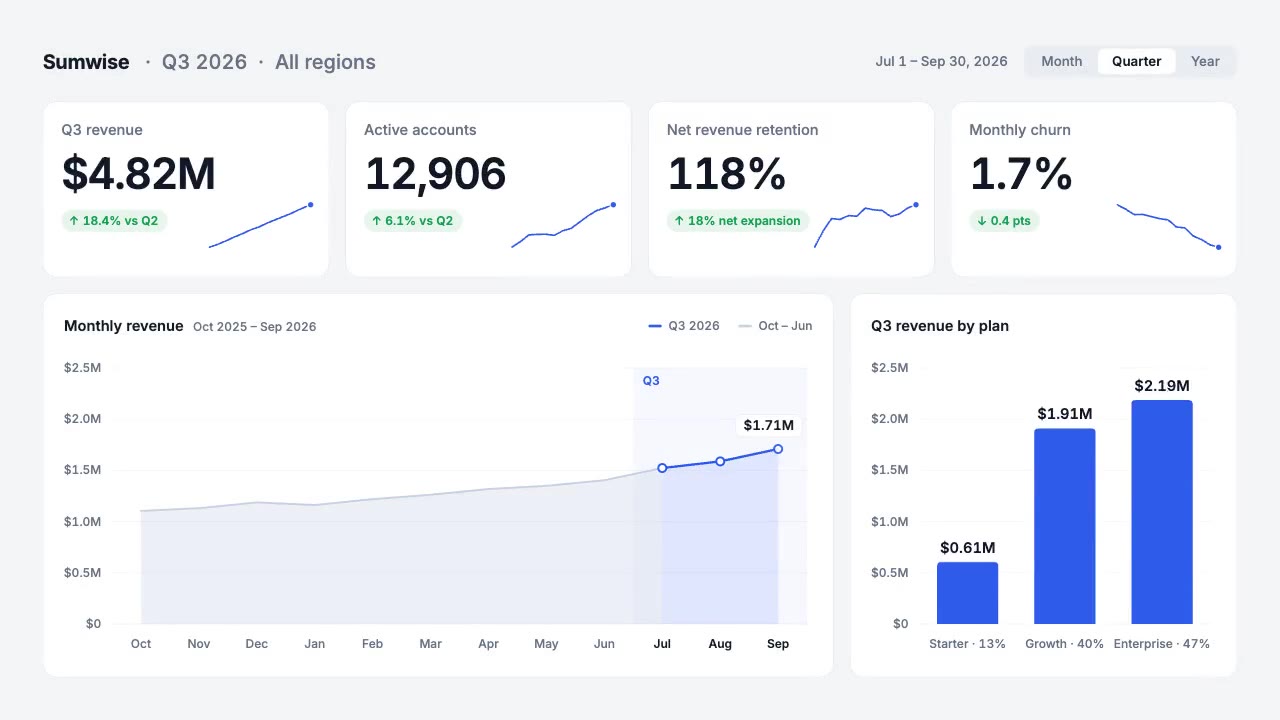
A light analytics dashboard builds itself from fictional data that adds up: counters roll on tabular figures, sparkline…
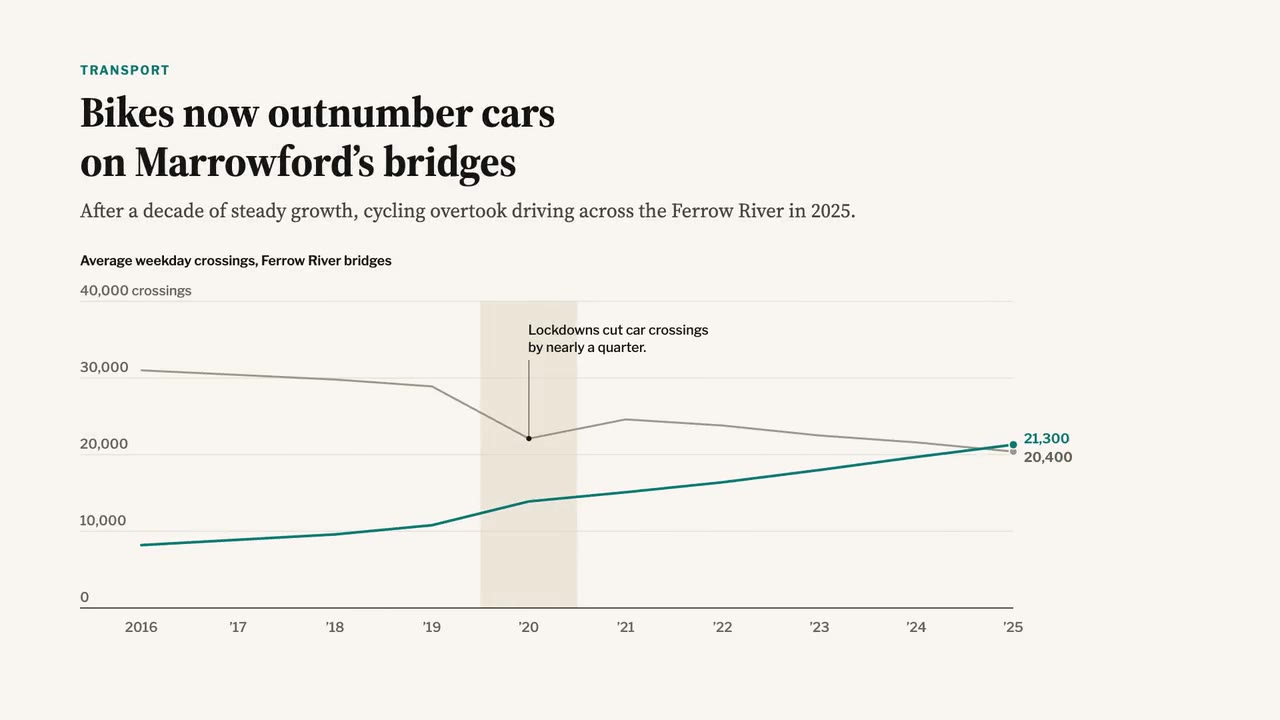
A newspaper-grade animated chart: serif headline and dek, a two-line chart that draws year by year, a shaded 2020 band,…
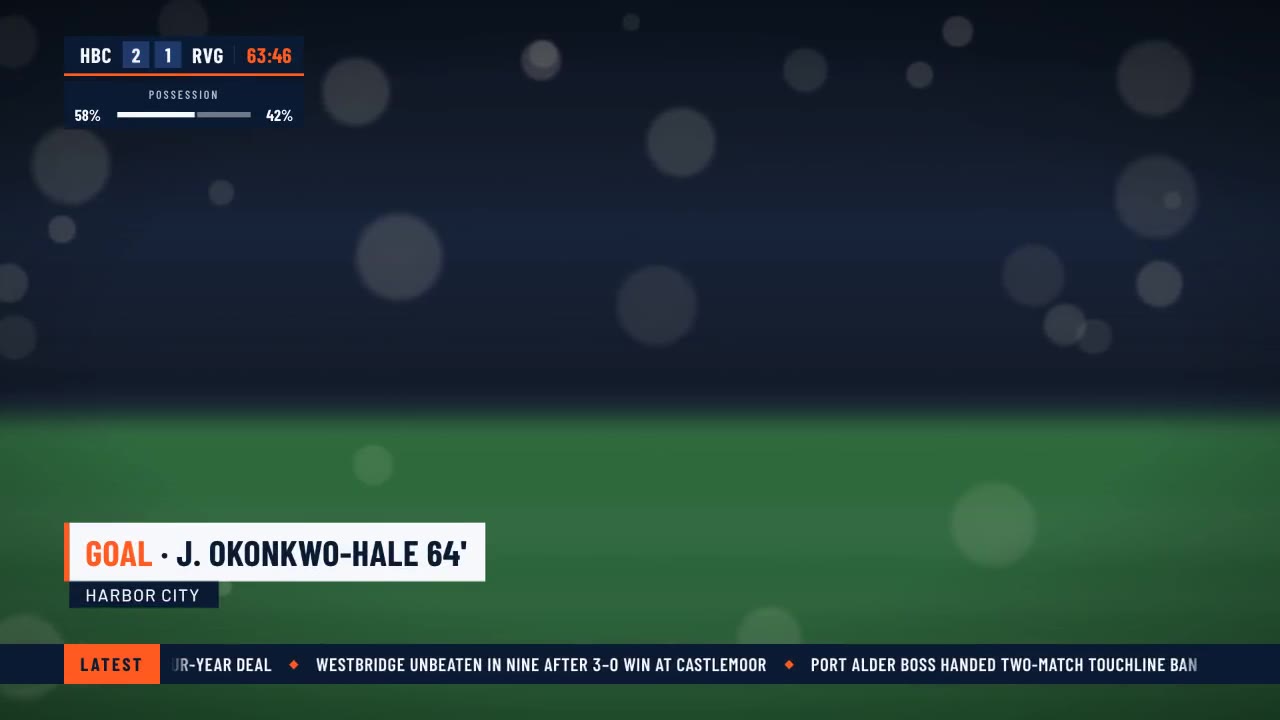
A crisp live-sports graphics package over a soft-focus stadium feed: score bug with running clock, layered lower third,…
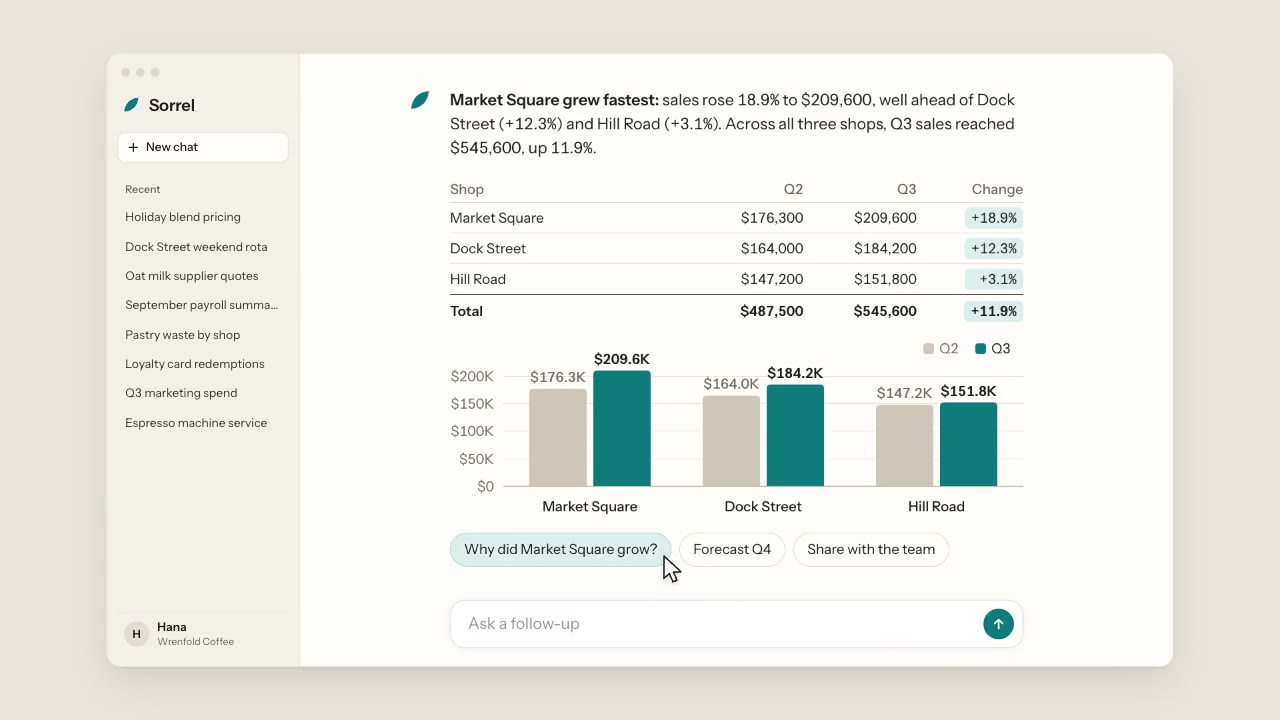
A warm, light chat app: a cursor types a question about three coffee shops, the assistant streams its answer word by wo…
More like this on the motion design inspiration board: Data visualization inspiration