
Premium
Treemap Market Map
A squarified market map of a fictional exchange on graphite: tiles build row by row and flush red or green with each stock's move as the numbers count, then the view zooms into semiconductors, re-squarifies its tiles and draws intraday sparklines.
Written and rendered by AI CSS Animations Nov 2, 2026
- Type
- prompt
- Made with
- Claude Opus 5.5 in Claude Code
- Built in
- SVG
- Topics
- Charts
About this style
Market maps show a whole exchange at once: every company is a rectangle sized by market value and colored by how far its price moved, grouped by sector. The squarified treemap layout keeps rectangles close to square so their sizes stay comparable, and zooming into one sector trades the overview for detail. Trading desks, newsrooms and investing apps use the format because size and direction read in a single glance.
Premium
Unlock the prompt
Everything you see above is live. Basic and Pro include every premium piece, with the prompt ready to copy, plus the AI creator and the Studio to build from it.
Similar prompts
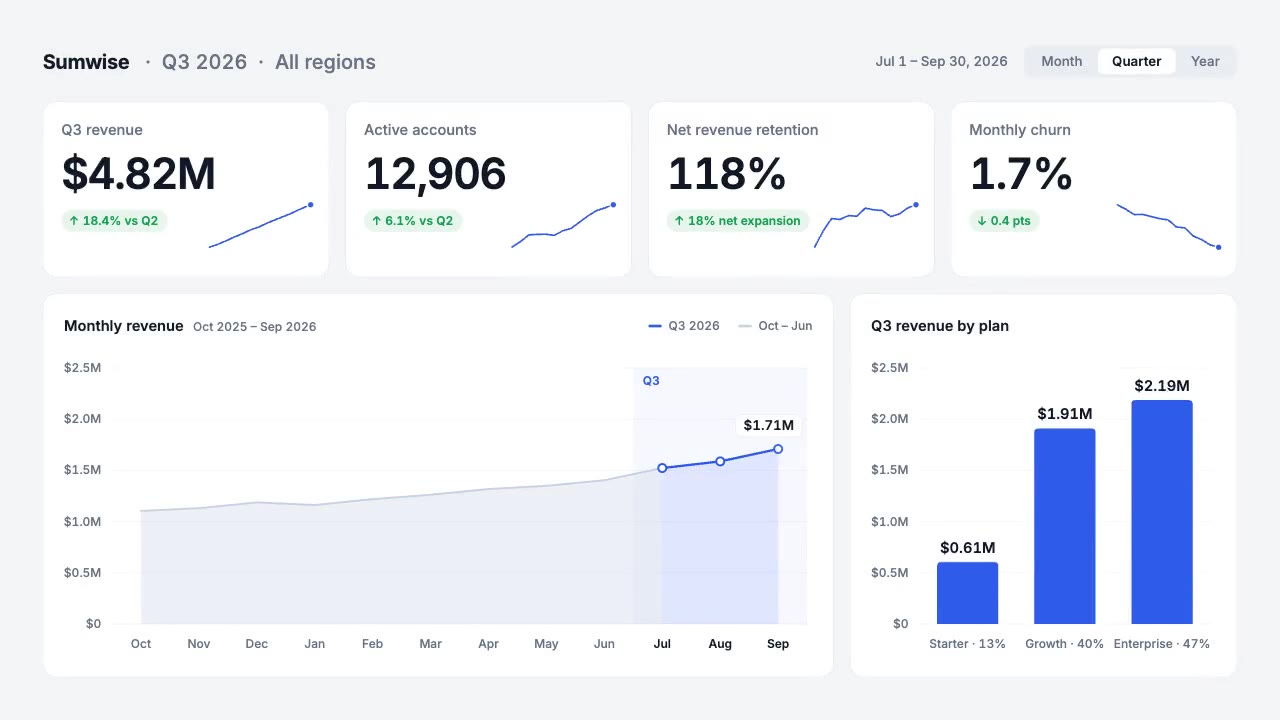
A light analytics dashboard builds itself from fictional data that adds up: counters roll on tabular figures, sparkline…
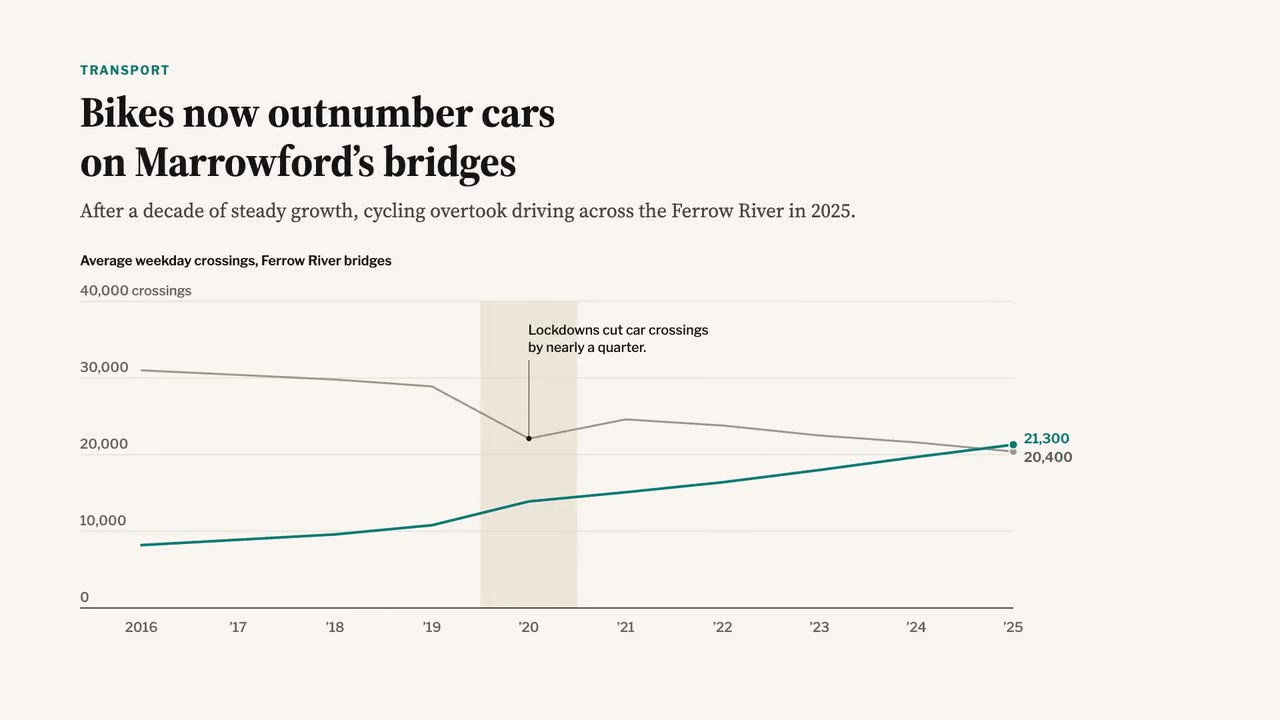
A newspaper-grade animated chart: serif headline and dek, a two-line chart that draws year by year, a shaded 2020 band,…
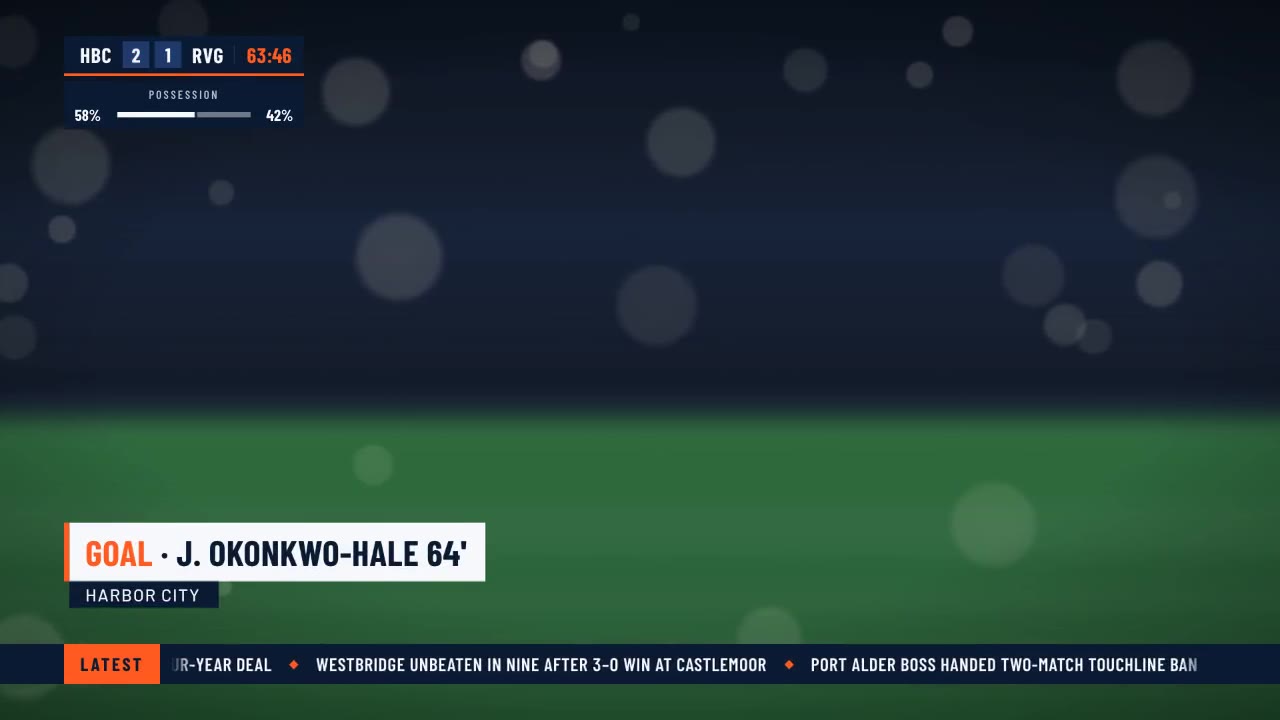
A crisp live-sports graphics package over a soft-focus stadium feed: score bug with running clock, layered lower third,…
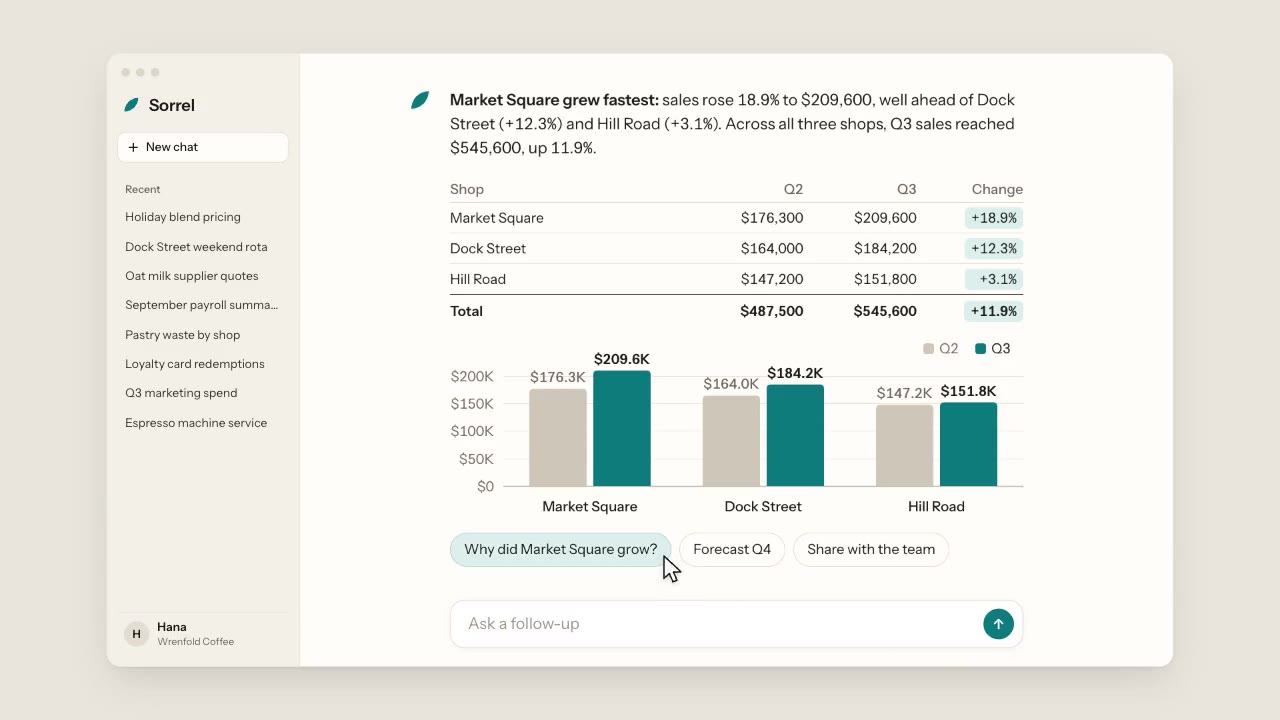
A warm, light chat app: a cursor types a question about three coffee shops, the assistant streams its answer word by wo…
More like this on the motion design inspiration board: Data visualization inspiration