
Status Page Uptime
A public status page fills six rows of 90-day uptime bars, then Webhooks turns amber as an incident opens, posts its updates and resolves, the banner returns to green and today's bar keeps its amber mark.
Written and rendered by AI CSS Animations Oct 19, 2026
- Type
- prompt
- Made with
- Claude Opus 5.5 in Claude Code
- Built in
- HTML/CSS
- Topics
- SaaS promo · Product UI · Charts
About this style
Public status pages became standard for software companies during the 2010s, as customers came to expect one place to check whether a problem was theirs or the vendor's. The usual layout is a banner with the overall state, a row per component with a strip of daily uptime bars, and a dated incident log written in plain stages: investigating, identified, monitoring, resolved. Companies use the page to earn trust, because a calm, specific incident write-up does more for a reputation than a perfect record nobody believes. In promo videos the format works as proof of reliability, and an incident that opens and resolves on screen tells a short, satisfying story.
The prompt
Make a 10-second status page story: six components fill their 90-day uptime bars, then Webhooks turns amber as an incident opens, posts its updates and resolves, the banner returns to green and today's bar keeps a small amber mark.

<inputs>
If I don't give you something, use the default and don't ask.
- Company: Quayside (fictional), a platform for scheduled jobs and webhooks; the page is status.quayside.dev. Wordmark "quayside" beside an original mark: a mooring bollard drawn as a rounded post with a wider cap, 28px tall.
- Today: Monday, October 19, 2026 (the last of the 90 bars).
- Components, 90-day uptime and past marks (days ago · color · what happened):
  API · 99.98% · 61 days ago, amber (elevated latency, 26 min)
  Dashboard · 100.00% · none
  Webhooks · 99.97% before today's incident, 99.93% after it · 23 days ago, red (delivery outage, 14 min); 8 days ago, amber (elevated error rate, 25 min)
  Scheduled jobs · 99.99% · 71 days ago, amber (delayed runs, 13 min)
  Search · 99.95% · 40 days ago, amber (slow queries, 65 min)
  File storage · 100.00% · none
- Incident "Delayed webhook deliveries", affecting Webhooks:
  Investigating · 10:42 UTC · "About 4% of webhook deliveries are timing out. Retries are queued and no events have been lost."
  Identified · 10:58 UTC · "A queue node in our Virginia region is dropping connections. We're moving traffic to healthy nodes."
  Monitoring · 11:09 UTC · "Traffic has moved. The failure rate is back under 0.1% and queued retries are going out."
  Resolved · 11:31 UTC · "All 18,412 delayed webhooks have been delivered. Total impact: 49 minutes. We'll publish a review by Oct 21."
- Webhook failure rate for the sparkline: 0.04% before, 4.1% at Investigating, 2.6% at Identified, 0.08% at Monitoring, 0.02% at Resolved.
- Past incidents listed before today's: "Oct 11 · Elevated error rate on Webhooks · Resolved" and "Sep 26 · Webhook delivery outage · Resolved".
- Tooltip on Webhooks' bar for today: "Mon, Oct 19 · Degraded for 49 min · Delayed webhook deliveries".
- Length: 10 seconds.
</inputs>

<direction>
- Look: a real, trustworthy public status page, white and orderly, the kind engineers keep open in a tab. The drama lives only in color changes, the banner and short written updates; everything else stays still and precise. Pacing is calm, then a tense middle, then calm again.
- Palette: page #F7F8F5; cards #FFFFFF with 1px #E3E6E0 borders, radius 12; ink #18211C; muted #69736C; faint #A9B1AB; row rules #EEF0EC. Bars: operational #2F9E5E, degraded #E0A21B, outage #D9534A. Banner green #23864F and banner amber #A8690A, both with white text. Stage colors: Investigating #C9472F, Identified #A8690A, Monitoring #2F6FB0, Resolved #23864F. These colors only ever mean status; nothing is colored for decoration.
- Type: Public Sans 700 for the wordmark (26px), banner text (28px) and incident title (24px); Public Sans 600 20px for component names; Public Sans 500 16px for status words; Public Sans 400 16px on a 24px line for update text; Azeret Mono 500 for times, percentages, the legend and the "Last updated" stamp (12–15px), with tabular figures.
- Layout:
  - Header y 56–124: the wordmark at x 160 with "Status" in muted beside it; a "Subscribe to updates" button at x 1560–1760, y 66–114, 1px ink border, radius 10, Public Sans 600 16px.
  - Banner x 160–1760, y 156–236, radius 12: a 26px icon at x 196 drawn in white strokes (a check in a circle when green; a triangle with a bar and dot when amber), the state text at x 238, and "Last updated 10:41 UTC" right-aligned at x 1728 in Azeret Mono 500 15px, white at 85%.
  - Components card x 160–1160, y 270–1006. Six rows of 116px from y 290, divided by 1px rules: the name at x 200, baseline top + 28; the status word right-aligned at x 1120 with an 8px status dot before it; 90 bars from x 200, each 7px wide with 3px gaps (ending at x 1097), from top + 42 to top + 82, radius 2; under the bars at baseline top + 104, in Azeret Mono 500 13px: "90 days ago" at x 200 (faint), "99.98% uptime" centered on x 648 (muted) and "Today" right-aligned at x 1097 (faint).
  - Right column x 1220–1760, y 270–1006, clipped at its edges. Before the incident it holds a "Today" card ("No incidents reported today." in muted) and a "Past incidents" card with the two past entries (date in Azeret Mono, title, "Resolved" in green). The incident card, when it arrives, takes the top of the column: the title at top + 44; a "Webhooks" chip and the current stage pill at top + 76; a sparkline "Webhook failure rate" 476×56 from top + 100 with its current value at the right; then the updates, newest first, each a stage word in its color (Public Sans 700 16px) with the time beside it in muted mono, then its text over at most three lines of 476px, 18px apart, joined by a 2px #E3E6E0 timeline at x 1244 with an 8px dot in the stage color at each update.
- Bars: past marks keep their colors for the whole piece; every other day is operational. Each bar is a solid rounded rectangle; no gradients, no gaps for missing data.
- Sparkline: an ink 2px line over the incident window, its area tinted #D9534A at 12% while the rate is above 1%; it extends one segment per update (0.4 s, easeInOutCubic) and its value label rolls to the new figure.
- Premium: the layout and wording of a real status page, uptime figures that add up (Webhooks loses 0.04 points for 49 minutes), stage colors used consistently, updates written like a calm engineer wrote them, and a today bar that honestly stays amber after the fix. Cheap: sirens, red flashing screens, shaking, alarm icons, glowing bars, fake 100% everywhere, dramatic countdowns.
- Banned: real company names, logos and UI copied from existing products, including real status page layouts and real cloud region names; flashing or pulsing alerts; glow; shake; emoji; anything flashing more than 3 times per second.
</direction>

<structure>
- 0.0–0.6s: the header and the green banner ("All systems operational") rise 12px and fade in (easeOutQuart 0.5 s).
- 0.4–1.7s: the components card fades in; rows start 0.1 s apart; in each row the name and status appear, then its 90 bars grow up from their baseline left to right, each bar starting 5 ms after the one before and growing over 0.18 s (easeOutCubic), past marks already in their colors; the legend line fades in when the row's bars are done.
- 1.0–1.6s: the right column's "Today" and "Past incidents" cards fade in.
- 1.7–2.0s: stillness; everything green.
- 2.0s: the incident opens: Webhooks' dot and status word crossfade to amber "Degraded performance" (0.3 s); its bar for today drains and refills amber from the bottom (0.3 s); the banner crossfades to amber with the triangle icon and "Degraded performance · Webhooks" (0.4 s); "Last updated" reads 10:42 UTC; the incident card slides down 24px into place and fades in (easeOutQuart 0.5 s) with the Investigating update, pushing the earlier cards down; the sparkline draws its spike to 4.1%.
- 3.2s: Identified posts at the top of the updates (older updates move down by the new one's height, easeOutCubic 0.4 s, while it fades in); the stage pill and "Last updated" change to Identified and 10:58 UTC; the sparkline extends to 2.6%.
- 4.4s: Monitoring, 11:09 UTC; the sparkline falls to 0.08%.
- 5.4s: Resolved, 11:31 UTC: the banner crossfades back to green "All systems operational" (0.4 s); Webhooks returns to green "Operational"; its bar for today stays amber; its uptime rolls from 99.97% to 99.93%, digit by digit (0.4 s).
- 6.0s: the poster: the green banner, six full rows with Webhooks' amber bar for today, and the resolved incident card with the sparkline and all four updates.
- 6.4–7.3s: a cursor (black arrow, white outline) glides to Webhooks' bar for today; at 6.9 s the bar gains a 2px ink outline and a dark tooltip (#18211C, white Public Sans 500 14px, radius 8, a 6px pointer) appears above it with the tooltip text.
- 7.6–8.3s: the cursor moves to "Subscribe to updates" and the button fills ink with white text on hover (0.15 s); the tooltip and the bar outline fade.
- 8.3–10.0s: hold.
For other lengths, stretch the gaps between updates; keep the bar cascade and at least 1 s of hold.
</structure>

<build>
- One self-contained index.html (inline CSS and JS), a 1920×1080 (16:9) stage scaled to fit the window, designed for 60fps. No image, video, texture or model files: icons, the cursor and the sparkline are drawn in code.
- window.seek(t), t in seconds, computes every visual from t alone: no CSS transitions or CSS animations, no setTimeout/setInterval, no state carried between frames, randomness only from a seeded PRNG. The incident's state at any t (current stage, banner color, list positions, sparkline length) comes from one timed script. Past the end, seek clamps to the last frame.
- Without ?render in the URL, drive seek from requestAnimationFrame so it plays in a browser (loop after a 1s end hold); with ?render, don't start that loop.
- Google Fonts via <link> are fine; await document.fonts.load() for each face before defining window.seek.
- Engine: HTML and CSS, every element absolutely positioned on the 1920×1080 stage; the 540 bars are divs created once at load; seek writes heights, colors, transforms, opacities and text directly as inline styles. The sparkline and icons are inline SVG updated by seek.
</build>

<check>
Before showing me, step through one frame per second (t = 0…10): screenshot each and look at it. Fix overlaps, clipped or cramped text, and anything off-style or Banned. Check that every row has exactly 90 bars ending at x 1097, the past marks sit on the right days, Webhooks' bar for today is amber from 2.0 s to the end, the banner is amber only between 2.0 and 5.4 s, the updates appear newest first with times in order (10:42, 10:58, 11:09, 11:31), no update text runs past its card or under the clip, Webhooks reads 99.93% after the fix, the tooltip sits over the right bar, nothing flashes or pulses, the 6.0 s frame matches the poster description, and the final frame shows the green page with the tooltip gone and the Subscribe button in its hover state. Confirm seek(10) and seek(11) match, so the final frame holds.
</check>
Ours, and free to use under CC0: copy it, change it, ship it. No credit needed.
Similar prompts
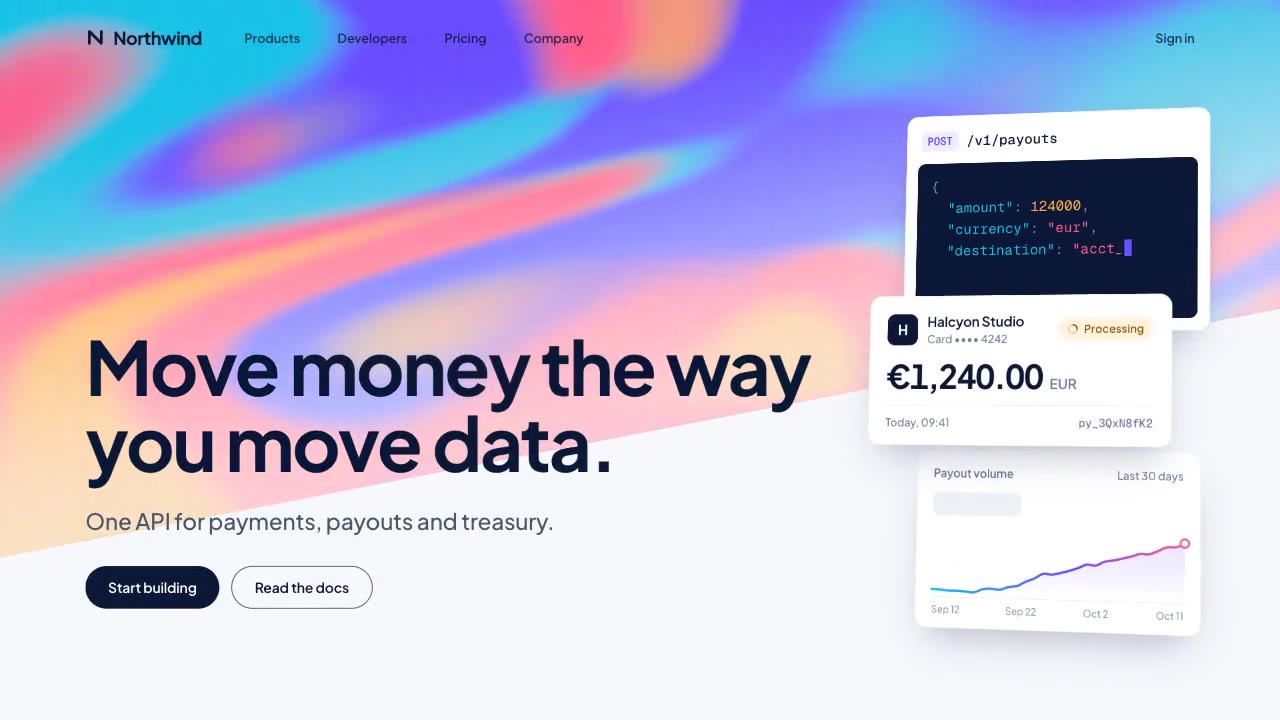
A slow, ribbon-like gradient mesh flows in a skewed band behind sharp headline type, while white payment, API and chart…
A device built in three.js rises out of total darkness while a softbox reflection glides along its titanium edge, then…
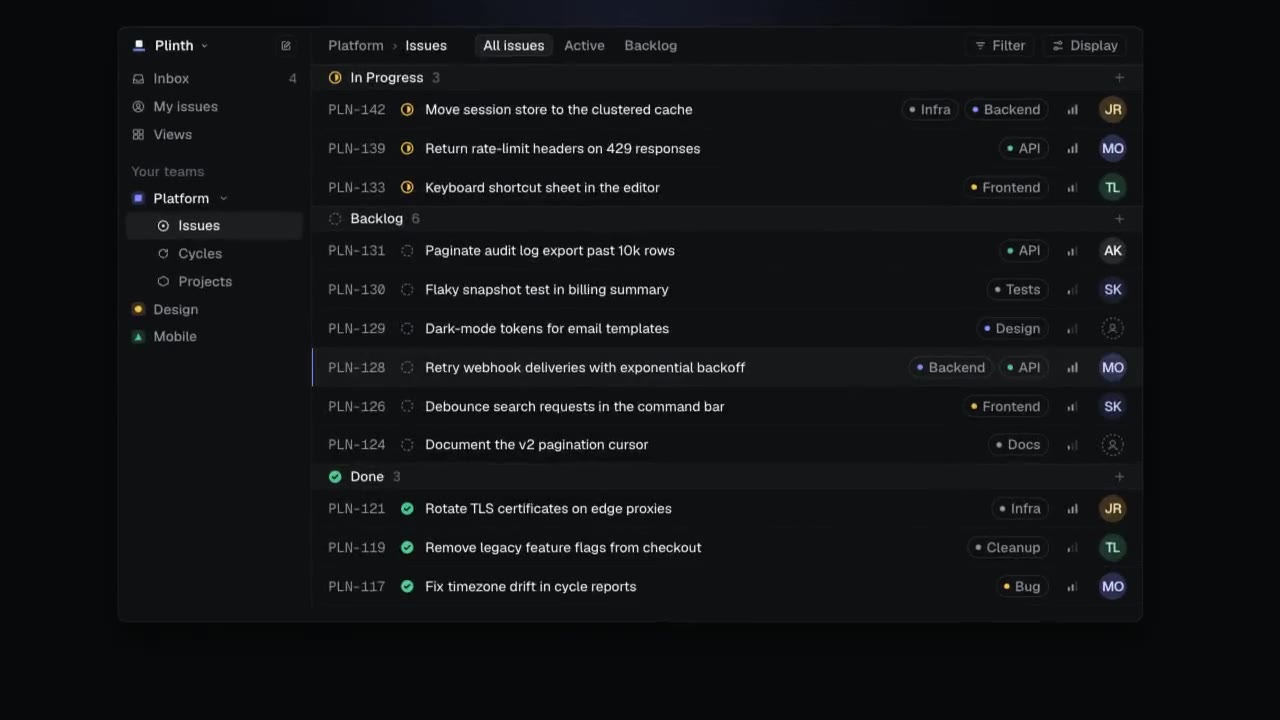
A dark-mode work tool drawn in hairlines and quiet radial glows: issue rows populate, ⌘K opens a command menu, a comman…
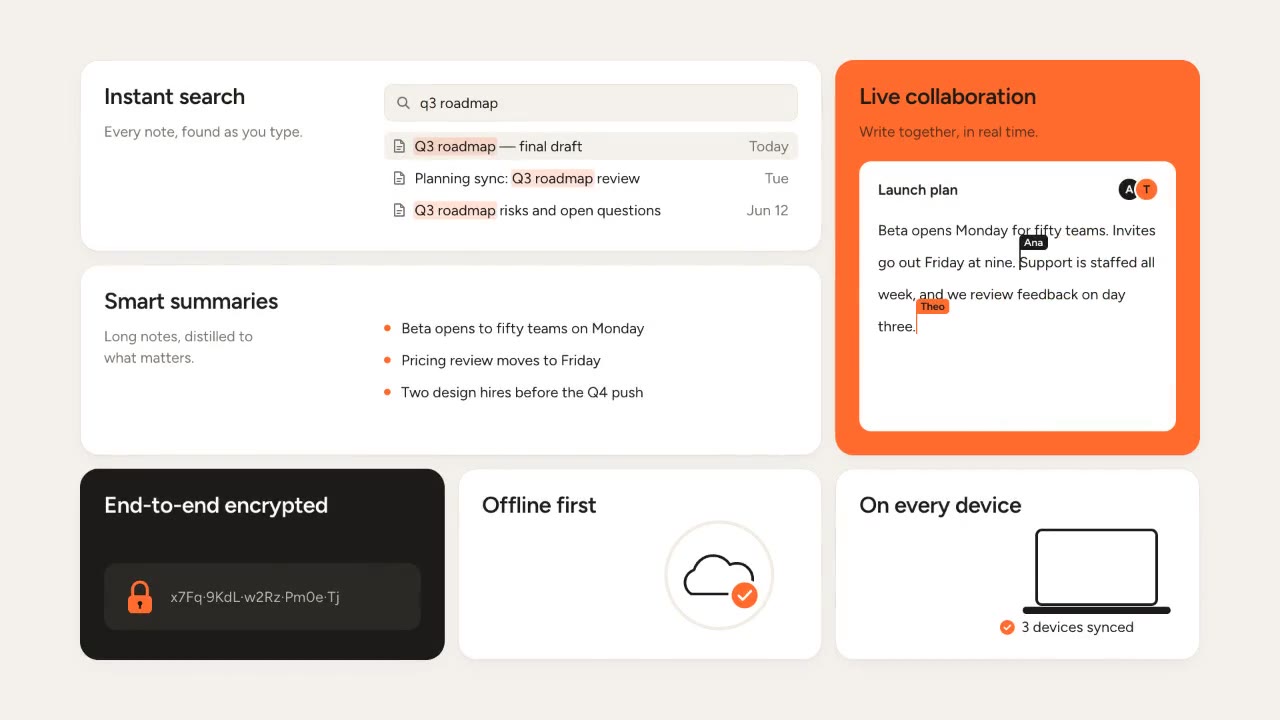
Rounded tiles spring into a bento grid on warm paper, each acting out one feature in a small animation, then the tiles…
More like this on the motion design inspiration board: UI animation inspirationSaaS video inspirationData visualization inspiration