
Premium
Population Pyramid
A fictional country's population pyramid on cream from 1950 to 2050: mirrored age bars ease from a triangle into a column as an odometer year rolls, the baby-boom generation glows red as it climbs the age axis, and two serif annotations mark the turns.
Written and rendered by AI CSS Animations Nov 2, 2026
- Type
- prompt
- Made with
- Claude Opus 5.5 in Claude Code
- Built in
- SVG
- Topics
- Charts · Explainer
About this style
A population pyramid stacks a country's people by age, men on one side and women on the other, so its outline tells the country's history at a glance: a wide base for many births, a narrowing top for high mortality, bulges for booms and dents for wars. Animated across a century, the shape turns from a triangle into a column as births fall and people live longer, and a single generation can be followed as it climbs. Statistics offices, newsrooms and teachers use the form because it makes ageing visible.
Premium
Unlock the prompt
Everything you see above is live. Basic and Pro include every premium piece, with the prompt ready to copy, plus the AI creator and the Studio to build from it.
Similar prompts

A light analytics dashboard builds itself from fictional data that adds up: counters roll on tabular figures, sparkline…
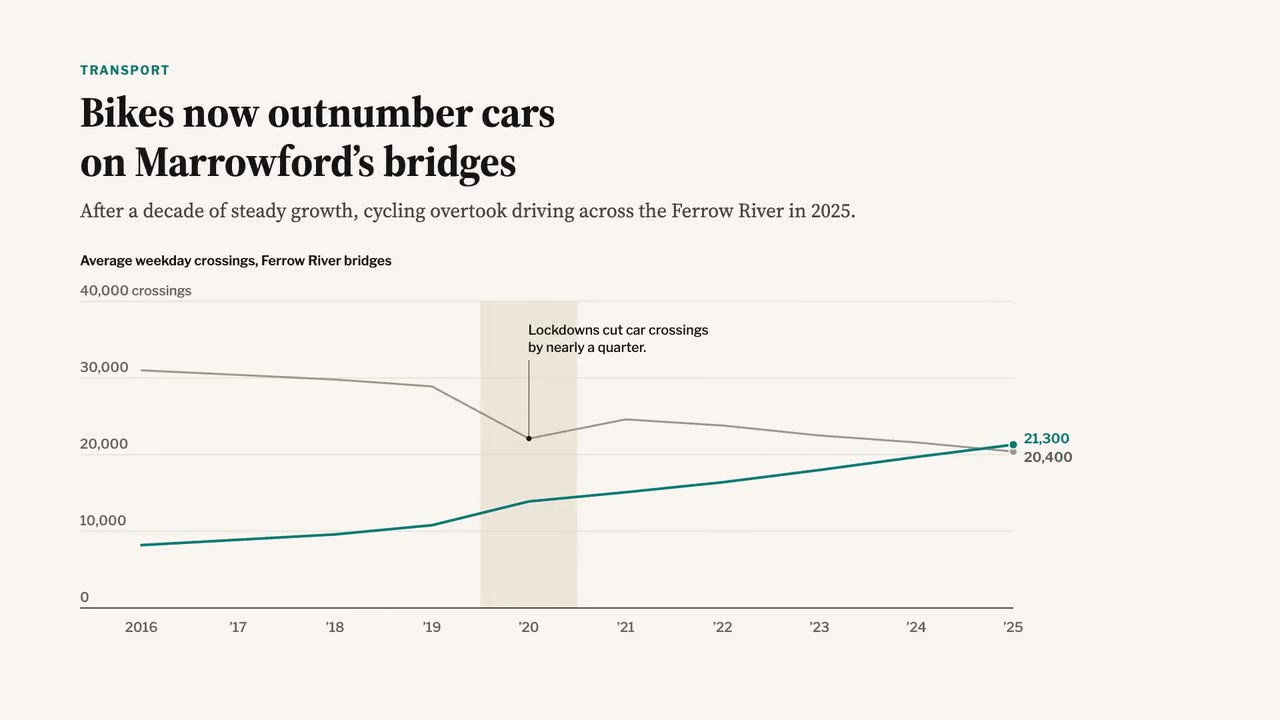
A newspaper-grade animated chart: serif headline and dek, a two-line chart that draws year by year, a shaded 2020 band,…

A crisp live-sports graphics package over a soft-focus stadium feed: score bug with running clock, layered lower third,…
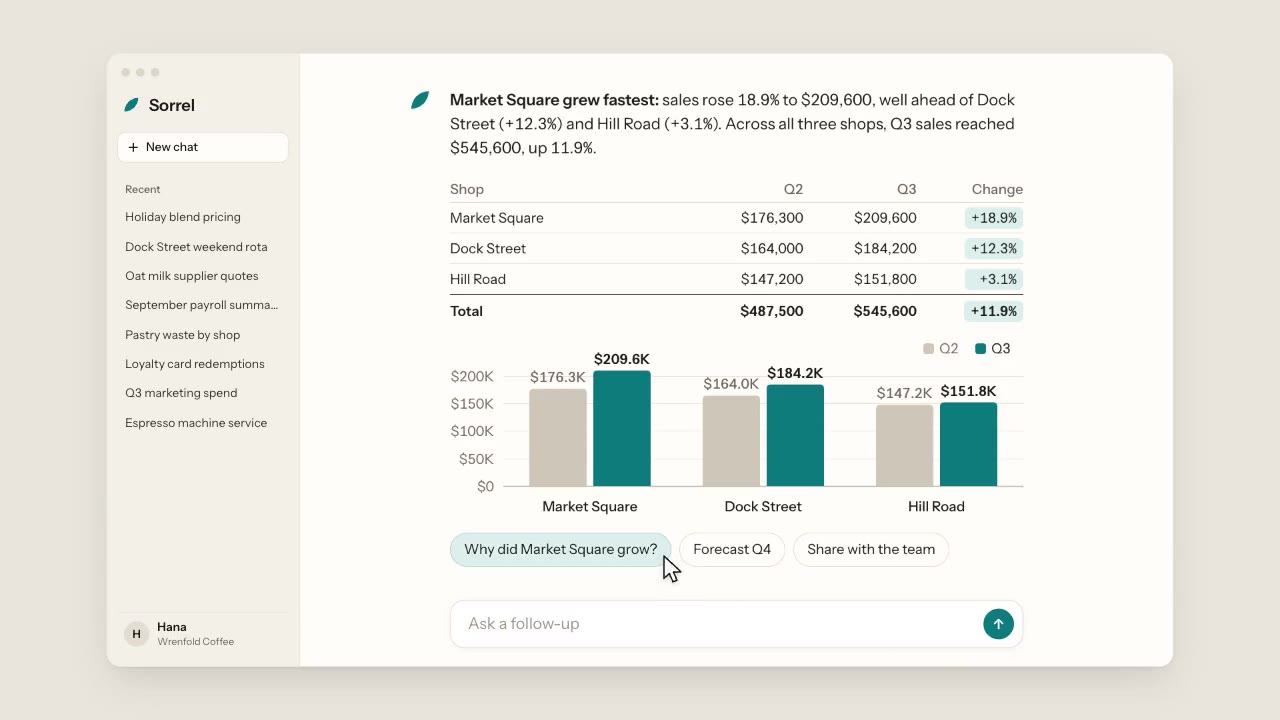
A warm, light chat app: a cursor types a question about three coffee shops, the assistant streams its answer word by wo…
More like this on the motion design inspiration board: Explainer video inspirationData visualization inspiration