
Premium
Periodic Table Trends
A crisp periodic table on paper white: 118 element tiles cascade in by group, colour rises through each tile into a heat map of covalent radius, a wavefront from fluorine turns it into electronegativity, and copper lifts out of its slot into a detail card.
Written and rendered by AI CSS Animations Nov 2, 2026
- Type
- prompt
- Made with
- Claude Opus 5.5 in Claude Code
- Built in
- HTML/CSS
- Topics
- Charts · Explainer
About this style
The periodic table orders the elements by atomic number into 18 groups and 7 periods, so properties repeat in patterns. Atoms grow larger down a group as electron shells are added and smaller across a period as nuclear charge pulls harder, while electronegativity, how strongly an atom attracts shared electrons, rises toward fluorine. Heat maps of these trends are a classic way to teach why the table is shaped as it is.
Premium
Unlock the prompt
Everything you see above is live. Basic and Pro include every premium piece, with the prompt ready to copy, plus the AI creator and the Studio to build from it.
Similar prompts
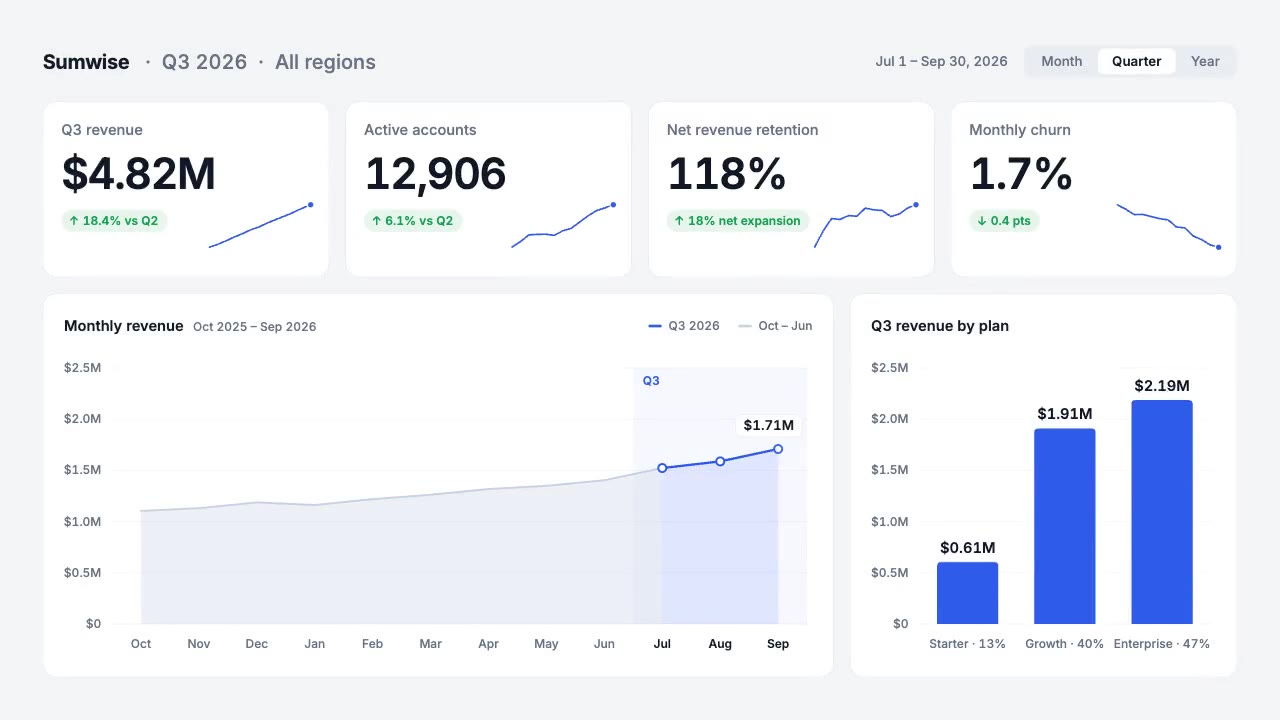
A light analytics dashboard builds itself from fictional data that adds up: counters roll on tabular figures, sparkline…
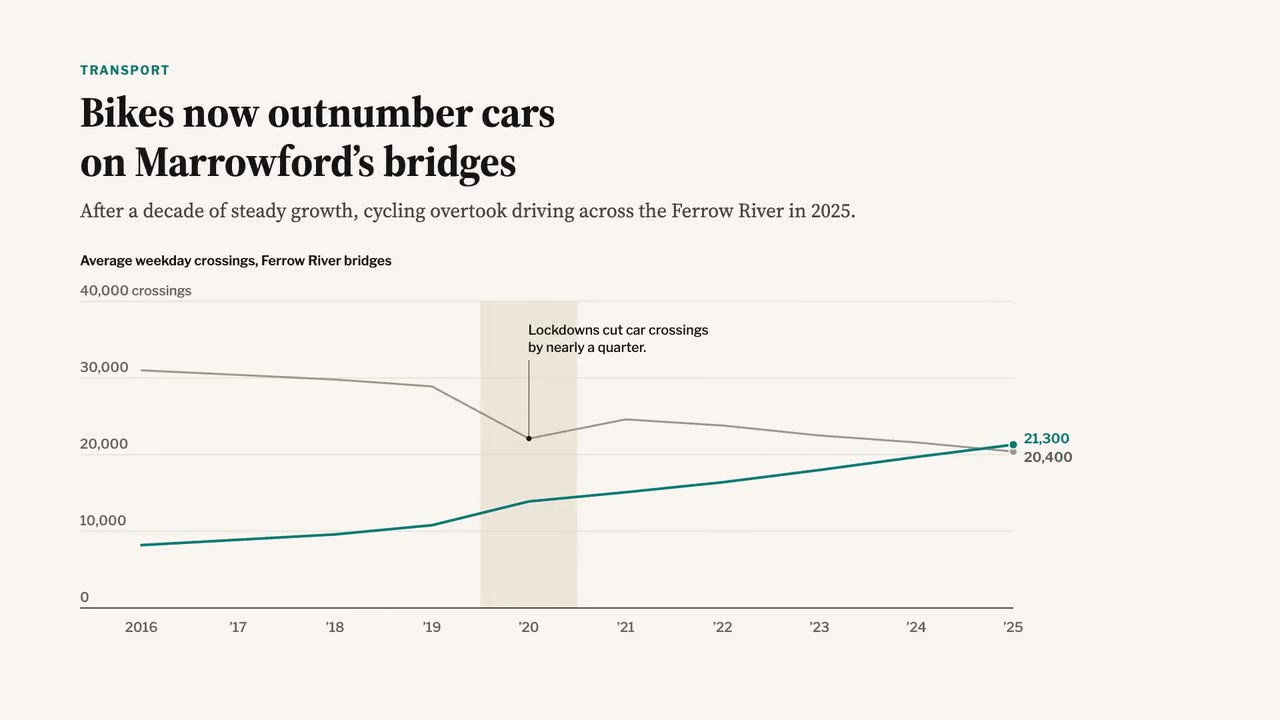
A newspaper-grade animated chart: serif headline and dek, a two-line chart that draws year by year, a shaded 2020 band,…

A crisp live-sports graphics package over a soft-focus stadium feed: score bug with running clock, layered lower third,…
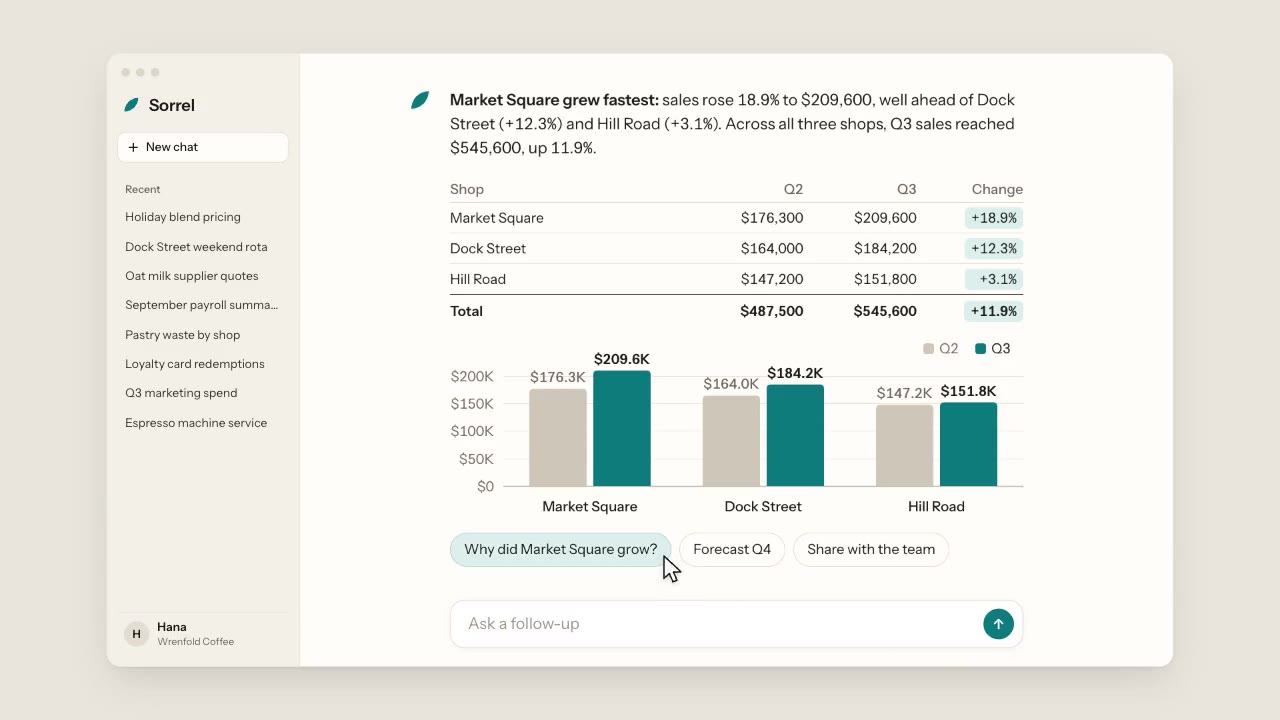
A warm, light chat app: a cursor types a question about three coffee shops, the assistant streams its answer word by wo…
More like this on the motion design inspiration board: Explainer video inspirationData visualization inspiration