
3D Data City
An ultramarine 3D bar chart grows like a city one month at a time, then a drone-like camera glides down a summer avenue past screen-facing value tags and rises to show the single orange peak tower, its callout and a totals line that adds up.
Written and rendered by AI CSS Animations Oct 16, 2026
- Type
- prompt
- Made with
- Claude Opus 5.5 in Claude Code
- Built in
- three.js
- Topics
- Charts · 3D
About this style
A 3D bar chart on a grid turns a table into a skyline: each row and column becomes a street of towers, so two categories and a magnitude read at once. Data designers keep the form honest with one consistent height scale, a visible grid and labels that face the screen rather than 3D text that warps with perspective. Monochrome renders, where one hue carries the whole scene and a single accent marks the finding, are common in editorial and brand data films because they keep attention on the story.
The prompt
Make a 10-second 3D data film: a bar chart rises from a grid like a city skyline and the camera glides down its avenues.

<inputs>
If I don't give you something, use the default and don't ask.
- City: Vellmark (fictional).
- Title: "Where Vellmark makes its power"
- Dek: "Rooftop solar output by district and month, in megawatt-hours"
- Districts and yearly output (MWh): Riverside 15,500 · Harbourside 13,000 · Hollins Rise 11,000 · Old Mill 9,500 · Kettle Hill 7,500 · Fernbrook 6,500 (63,000 in all).
- Monthly share of each district's year, Jan–Dec: 3.6%, 5.0%, 8.0%, 10.0%, 12.0%, 12.8%, 13.0%, 11.6%, 9.2%, 6.8%, 4.6%, 3.4%. Each tower is yearly × share, always a whole number.
- Callouts: "Riverside, July: 2,015 MWh, the city's peak" and "63,000 MWh in all · 49.4% of it from May to August".
- Length: 10 seconds.
</inputs>

<direction>
- One hue, one accent: the whole world is ultramarine and a single orange tower tells the story. Background and fog #1F2CB8, lifting to #3445D6 at the horizon; ground #1B27A6 with 1px grid lines #3B4DE0; towers #5E6DF2 with brighter top caps #B4BCFF; shadows fall as deeper blue, never black. Accent #FF8A3D (emissive 0.25) on the peak tower only. Labels #FFFFFF and #C8CEFF.
- The city: 12 month columns along x, 6 district rows along z, Riverside nearest the camera's final view. Towers are 1.0 × 1.0 units with 0.5-unit streets and a wider 1.6-unit avenue after every third month (the quarters). Height is 1 unit per 250 MWh, so Riverside in July stands 8.06 units and Fernbrook in December 0.88. Soft-bevelled boxes (RoundedBoxGeometry, radius 0.04), MeshStandardMaterial, roughness 0.7, metalness 0.
- Light: HemisphereLight #8C97FF / #101A80 at 0.9, and one DirectionalLight from upper left with soft shadows (PCFSoftShadowMap, 2048 map) so towers cast long blue shadows across the streets; fog fades the far rows into the sky color.
- Labels stay legible: they are HTML, positioned each seek by projecting 3D anchors, always screen-aligned at fixed sizes, never 3D text and never perspective-scaled. Month labels in Hanken Grotesk 600, 22px, along the front edge; district names Hanken Grotesk 600, 24px, like street signs at the left end of each row; tower values in Martian Mono 500, 22px, on a #1B27A6 pill with 10px padding, shown only for towers near the camera (fading in within 7 units, out once behind it) and hidden if they would overlap another label.
- Camera: fov 38, one continuous CatmullRom path paced with easeInOutSine: a high establishing view (pitch 58°) → down to 3.2 units above the street, gliding along the avenue between June and July past the summer peaks → rising to a final three-quarter view (pitch 32°, yaw 35°) with the whole grid in frame. It never passes through a tower.
- Type: title Hanken Grotesk 700, 64px, #FFFFFF, top-left at (120, 96); dek Hanken Grotesk 400, 28px, #C8CEFF, beneath. Callouts Hanken Grotesk 600, 30px, the peak's on a 1px white leader ending at its tower top, the totals line at bottom-left.
- Motion: towers grow from the ground over 0.6 s each (easeOutCubic), month by month left to right 0.15 s apart with 0.04 s between districts; nothing bounces. Text rises 12px as it fades in over 0.5 s on cubic-bezier(0.22, 1, 0.36, 1).
- Premium: one hue doing the work, a true height scale, labels as crisp as a flat chart, a camera that moves like a drone shot. Cheap: rainbow towers, wobbling 3D text, a spinning camera.
Banned: rainbow or height-graded colors, 3D text, labels overlapping each other or the towers they name, bloom, chrome, a second accent, the camera clipping through towers, anything flashing more than 3 times per second.
</direction>

<structure>
- 0.0–1.0s: the high view over an empty ultramarine ground; grid lines draw out from the near corner; the title and dek rise in.
- 1.0–3.6s: the towers grow, January to December; month and district labels appear as their first tower rises.
- 3.6–6.6s: the camera descends and glides down the June–July avenue at street height; value pills appear on the nearest towers and slide past.
- 6.6–7.8s: the camera rises to the final three-quarter view; the Riverside July tower turns orange over 0.4 s and its callout draws.
- 7.8–8.8s: the totals callout rises in at bottom-left.
- 8.8–10.0s: hold.
For other lengths, stretch the avenue glide first; keep at least 1 s of hold.
</structure>

<build>
- One self-contained index.html (inline CSS and JS), a 1920×1080 (16:9) stage scaled to fit the window, designed for 60fps. No image, video, texture or model files: every shape and texture is generated in code.
- window.seek(t), t in seconds, computes every visual from t alone: no CSS transitions or CSS animations, no setTimeout/setInterval, no state carried between frames, randomness only from a seeded PRNG. Anything cumulative is solved analytically from t or precomputed once at load at a fixed step. Past the end, seek clamps to the last frame.
- Without ?render in the URL, drive seek from requestAnimationFrame so it plays in a browser (loop after a 1s end hold); with ?render, don't start that loop.
- Google Fonts via <link> are fine; await document.fonts.load() for each face before defining window.seek.
- Engine: three.js as an ES module pinned to three@0.160.0 through an import map on jsDelivr (`three` and `three/addons/`). WebGLRenderer with antialias, preserveDrawingBuffer: true and setPixelRatio(window.devicePixelRatio); render once at the end of every seek. Text is HTML over the canvas.
- Tower heights come straight from the data; the camera position is a closed-form point on its path at t.
</build>

<check>
Before showing me, step through one frame per second (t = 0…10): screenshot each and look at it. Fix overlaps, clipped or cramped text, and anything off-style or Banned. Check every tower's height equals yearly × share at 250 MWh per unit, no label overlaps or clips, the camera is never inside geometry, and orange appears only on the peak tower. Confirm seek(10) and seek(11) match, so the final frame holds.
</check>
Ours, and free to use under CC0: copy it, change it, ship it. No credit needed.
Similar prompts
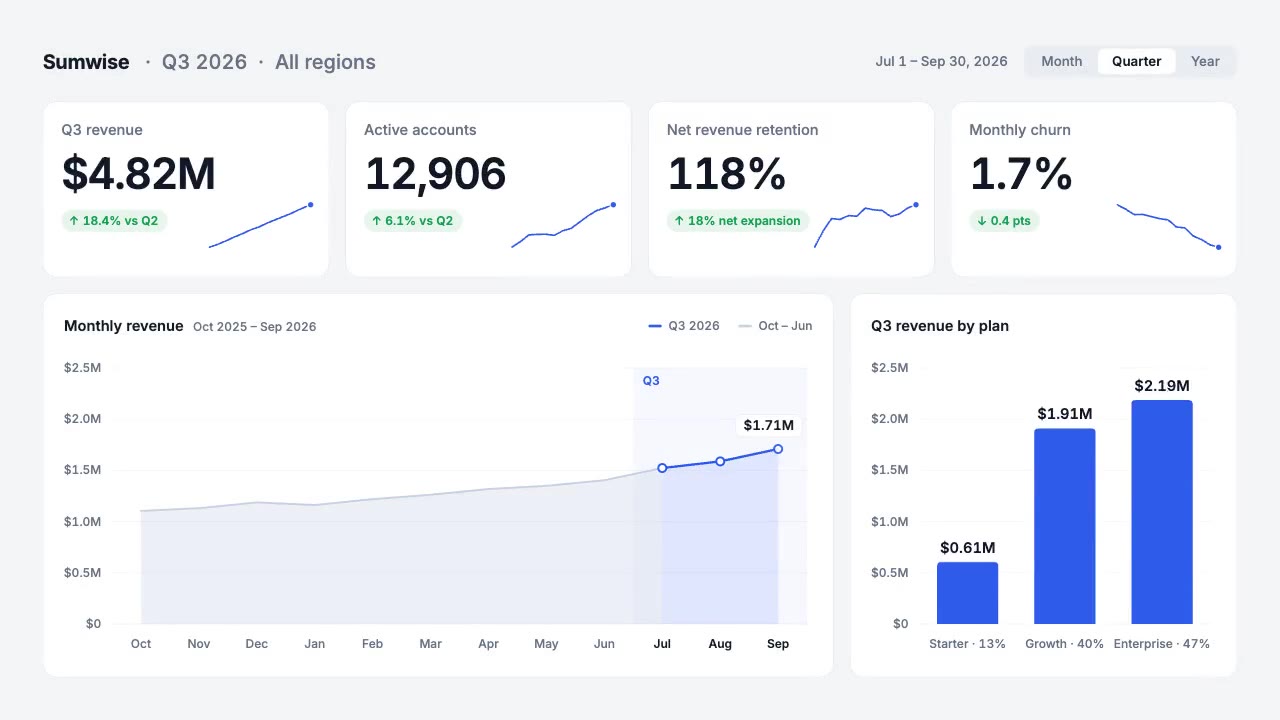
A light analytics dashboard builds itself from fictional data that adds up: counters roll on tabular figures, sparkline…
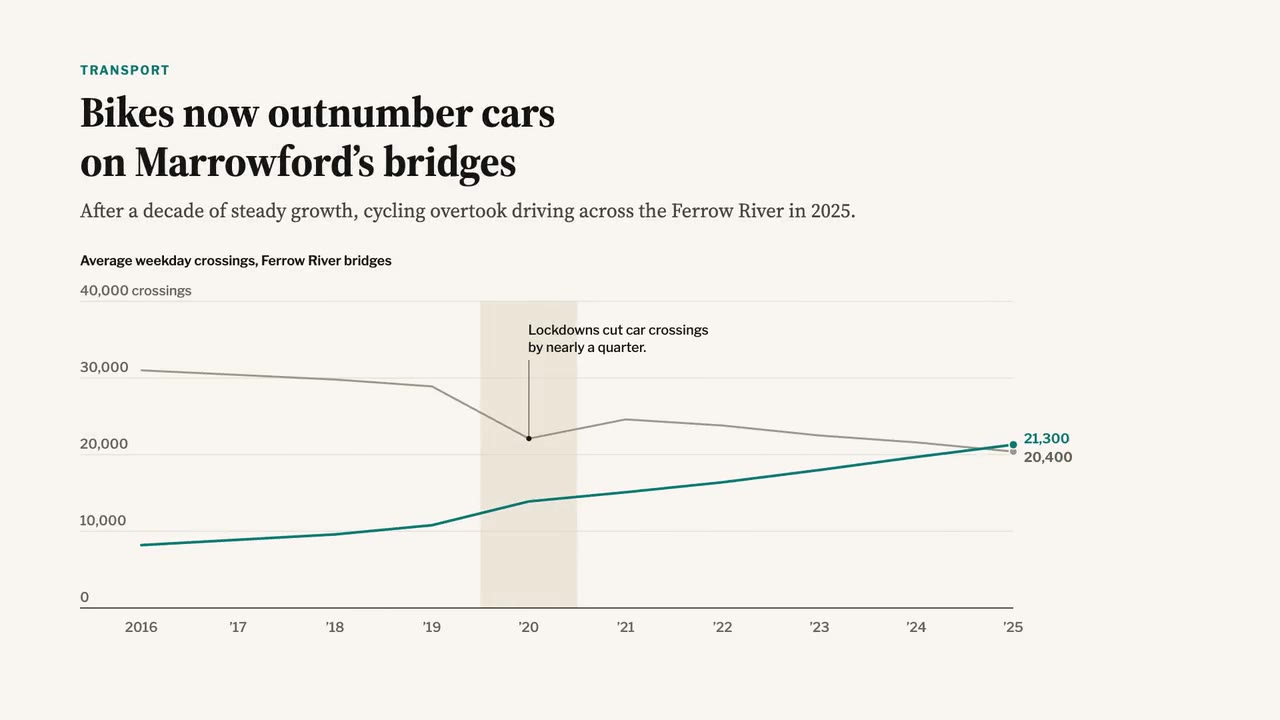
A newspaper-grade animated chart: serif headline and dek, a two-line chart that draws year by year, a shaded 2020 band,…
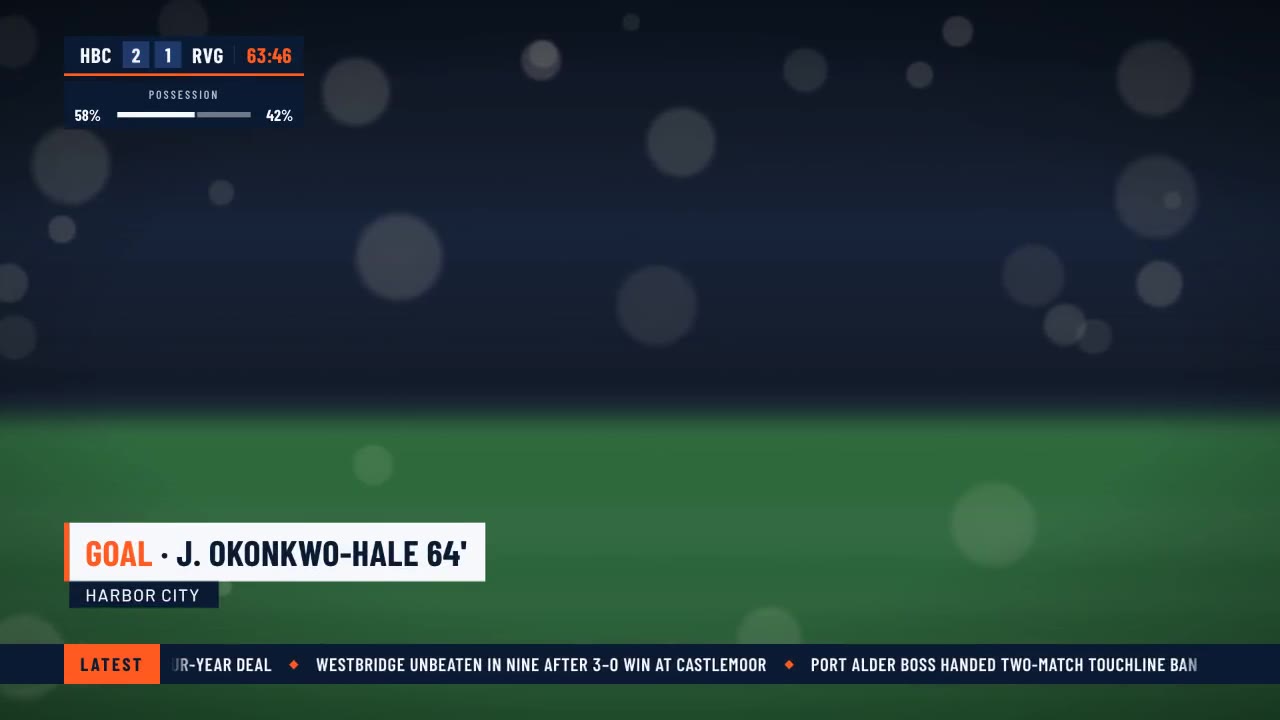
A crisp live-sports graphics package over a soft-focus stadium feed: score bug with running clock, layered lower third,…
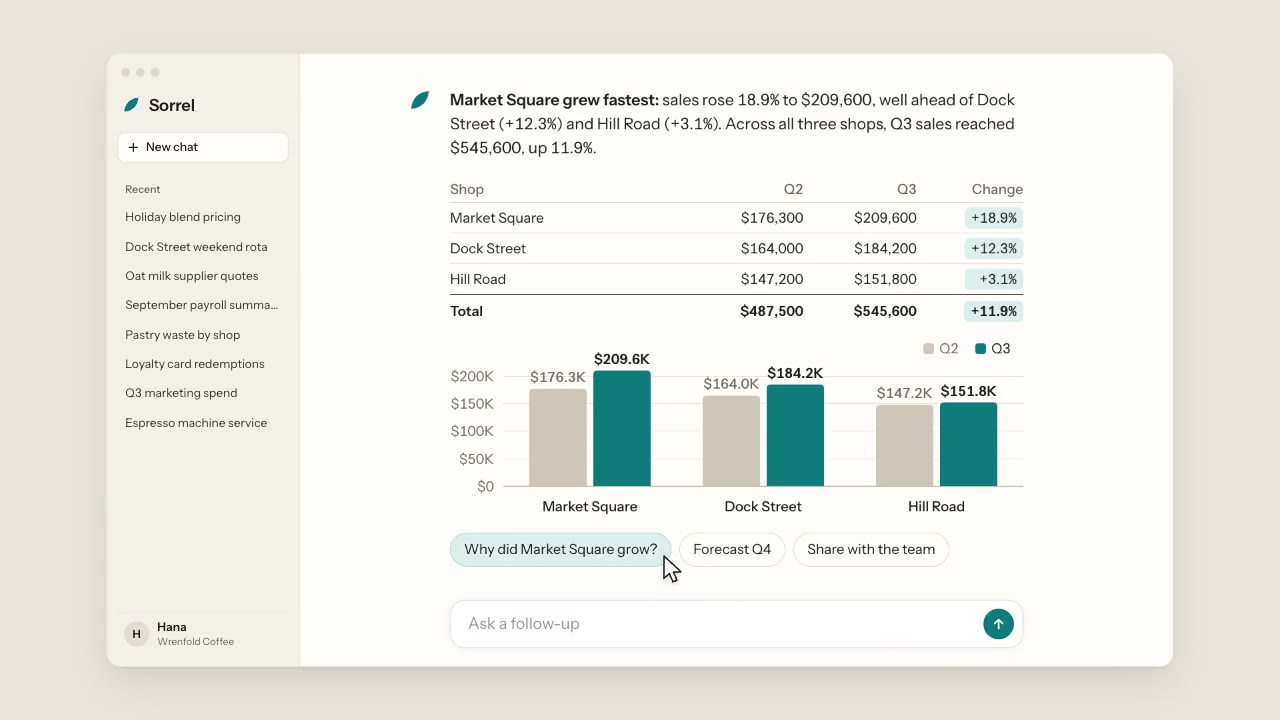
A warm, light chat app: a cursor types a question about three coffee shops, the assistant streams its answer word by wo…
More like this on the motion design inspiration board: 3D motion design inspirationData visualization inspiration