
Conversion Funnel
On a dark violet ground, 1,000 dots, each standing for 48 visits, pour through five funnel bars drawn to scale; leavers peel off into a heap, counters stop exactly on each stage's total, and 42 mint dots settle into a grid for 2,016 orders.
Written and rendered by AI CSS Animations Oct 18, 2026
- Type
- prompt
- Made with
- Claude Opus 5.5 in Claude Code
- Built in
- Canvas
- Topics
- Charts · Diagrams · Particles
About this style
The sales funnel traces back to the AIDA model of attention, interest, desire and action, credited to the advertising pioneer E. St. Elmo Lewis around 1898. Web analytics turned it into a measured chart: each stage shows how many people reached it and what share moved on to the next. Drawn to scale, the narrowing bars make the biggest leak visible at a glance, which is why product and marketing teams review funnels when deciding what to fix first.
The prompt
Make a 10-second conversion funnel explainer: a month of shop visits pours through five stages drawn to scale as particles, every dot counted, the leavers piling up to one side and the buyers settling into a grid.

<inputs>
If I don't give you something, use the default and don't ask.
- Shop: Selvedge & Spool, an online sewing shop (fictional).
- Title: "Where 48,000 visits went"
- Period: "1–30 September"
- Stages and counts: Visited 48,000 · Viewed a product 19,200 (40%) · Added to cart 5,760 (30%) · Started checkout 2,880 (50%) · Ordered 2,016 (70%).
- Callout: "Biggest leak: 70% of product viewers left before the cart."
- Result: "2,016 orders · 4.2% of visits"
- Scale: 1 dot = 48 visits.
- Length: 10 seconds.
</inputs>

<direction>
- Look: a dark, calm analytics film: one violet family for the structure, warm white for people in motion, one mint accent for the people who bought. Flat bars, crisp dots, numbers you can check.
- Palette: ground #170F26 with a soft #24173A lift behind the funnel; bars from #3A2A63 at the top through #45317A, #533A92 and #6243AB to #7350C7 at the bottom, each with a 2px #8E74E8 top edge; connectors in the same colors at 40%; dots #FFE7D1; leaving dots #8A7AA8 at 70%; ordered dots and the result mint #3DF0B4; text #F3EAFB, secondary #A99BC4.
- Funnel to scale: five stage bars 110px tall and 22px apart, centered on x 960 from y 230. Each bar's width is its count × 0.02px: 960, 384, 115, 58 and 40px. Between bars, trapezoid connectors taper from one width to the next. Nothing is widened for looks: the narrow neck is the story.
- Labels, left of each bar and right-aligned at x 440: the stage name in Urbanist 600, 24px; its count in Azeret Mono 500, 30px; and, from stage 2 on, the step rate and the visits that left before it, in Azeret Mono 400, 20px, secondary: "40% · −28,800", "30% · −13,440", "50% · −2,880", "70% · −864".
- Dots, exactly accounted for: 1,000 dots enter (48,000 ÷ 48), 400 reach stage 2, 120 stage 3, 60 stage 4 and 42 order. Choose which dots leave at each stage once at load with a seeded shuffle, so the numbers are exact. Dots (6px) fall into the top bar across its width, drift down through each bar under gravity with drag (terminal speed about 380px/s) and are guided toward the center through each connector. Leavers drift to the right edge of their bar, turn grey-violet and slip out through it, arcing down into a heap at the lower right (x 1480–1800, y 860–960) that builds grain by grain into a mound. Survivors that clear the last bar turn mint and settle into a neat 7 × 6 grid (10px pitch) beneath it. Each counter shows the dots that have entered its stage × 48, so it stops exactly on the given number.
- Type: kicker "SELVEDGE & SPOOL · SHOP REPORT" in Urbanist 700, 20px, tracked 0.14em, mint; title Urbanist 700, 60px, top-left at (120, 96); period in Urbanist 500, 26px, secondary, beneath; the result in Urbanist 700, 34px, mint, centered under the grid on baseline y 1000; "1 dot = 48 visits" in Azeret Mono 400, 20px, secondary, at the bottom-left (120, 1000); "Left without ordering: 45,984" in Azeret Mono 400, 20px, over the heap; the callout in Urbanist 600, 26px, at x 1480–1800 around y 400, on a 1px leader to the right edge of bar 2.
- Motion: bars grow outward from the center line over 0.5s on cubic-bezier(0.22, 1, 0.36, 1), 0.1s apart; text rises 12px as it fades in over 0.4s on the same curve; counter digits roll over 0.15s. Nothing glows.
- Premium: bars drawn to scale, every dot accounted for, rates that multiply out to the final count, and one accent reserved for buyers. Cheap: a glossy 3D cone with made-up percentages and a rainbow of stages.
Banned: 3D cones, gradients inside bars, rainbow stage colors, glow or bloom, dollar signs, shopping-cart icons, emoji, percentages that don't multiply out, dots vanishing uncounted, dots passing through bar walls except where they leave, anything flashing more than 3 times per second.
</direction>

<structure>
- 0.0–1.0s: the ground; the kicker, title and period rise in; the bars grow outward top to bottom and the labels set at zero.
- 1.0–4.0s: dots pour into the top bar, spawning evenly across 3.0s, and fall through the stages; counters climb; leavers peel off to the right and arc into the heap.
- 4.0–6.4s: the stream thins; the lower stages fill; mint dots settle into the grid one by one.
- 6.4–7.2s: the last dots settle; the heap's total and the result rise in.
- 7.2–8.2s: the callout and its leader draw in.
- 8.2–8.8s: the scale note fades in at the bottom-left.
- 8.8–10.0s: hold, nothing moving.
For other lengths, stretch the pour; keep at least 1s of hold.
</structure>

<build>
- One self-contained index.html (inline CSS and JS), a 1920×1080 (16:9) stage scaled to fit the window, designed for 60fps. No image, video, texture or model files: every shape and texture is generated in code.
- window.seek(t), t in seconds, computes every visual from t alone: no CSS transitions or CSS animations, no setTimeout/setInterval, no state carried between frames, randomness only from a seeded PRNG. Anything cumulative is solved analytically from t or precomputed once at load at a fixed step. Past the end, seek clamps to the last frame.
- Without ?render in the URL, drive seek from requestAnimationFrame so it plays in a browser (loop after a 1s end hold); with ?render, don't start that loop.
- Google Fonts via <link> are fine; await document.fonts.load() for each face before defining window.seek.
- Engine: Canvas 2D, repainting every frame from scratch, the backing store sized from CSS size × devicePixelRatio. Canvas won't fetch fonts itself, so the awaited loads matter. No other libraries.
- Simulate all 1,000 dots once at load at a fixed 1/120s step from a seeded PRNG into one Float32Array (bar walls, guidance through each connector, exits for leavers, precomputed resting slots in the heap and the grid); seek(t) only reads and interpolates it and never steps the simulation.
- Counters are counts over that table at t, multiplied by 48.
</build>

<check>
Before showing me, step through one frame per second (t = 0…10): screenshot each and look at it. Fix overlaps, clipped or cramped text, and anything off-style or Banned. Check the counts end exactly on 48,000, 19,200, 5,760, 2,880 and 2,016, the grid holds 42 mint dots, the heap reads 45,984, every bar's width is its count × 0.02px, no dot crosses a bar wall except a leaver at its exit, and the labels never collide with dots in flight. Confirm seek(10) and seek(11) match, so the final frame holds.
</check>
Ours, and free to use under CC0: copy it, change it, ship it. No credit needed.
Similar prompts
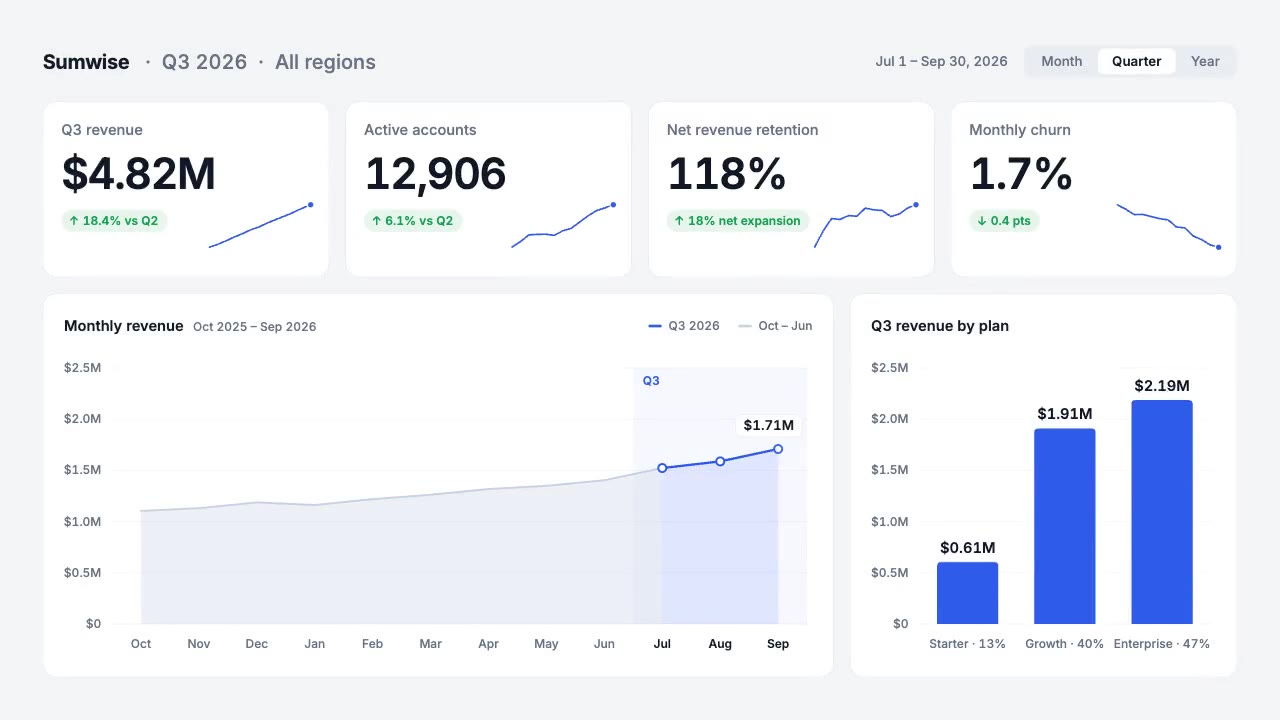
A light analytics dashboard builds itself from fictional data that adds up: counters roll on tabular figures, sparkline…
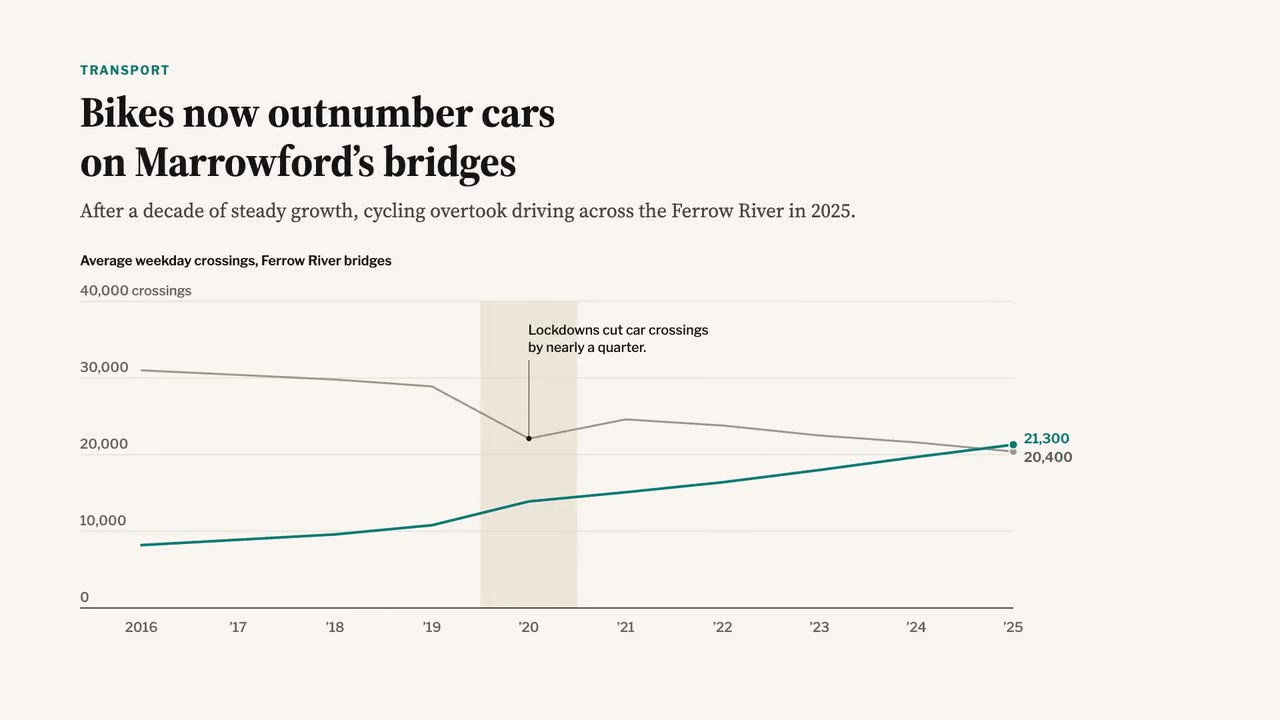
A newspaper-grade animated chart: serif headline and dek, a two-line chart that draws year by year, a shaded 2020 band,…
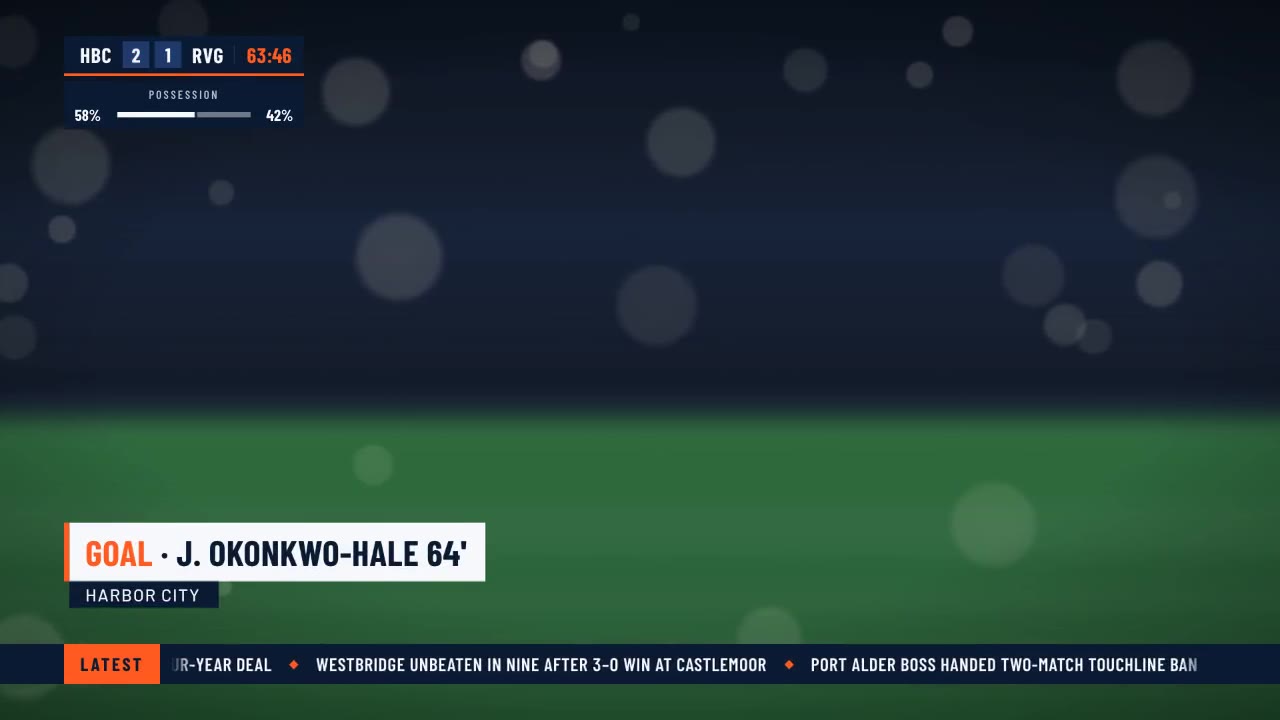
A crisp live-sports graphics package over a soft-focus stadium feed: score bug with running clock, layered lower third,…
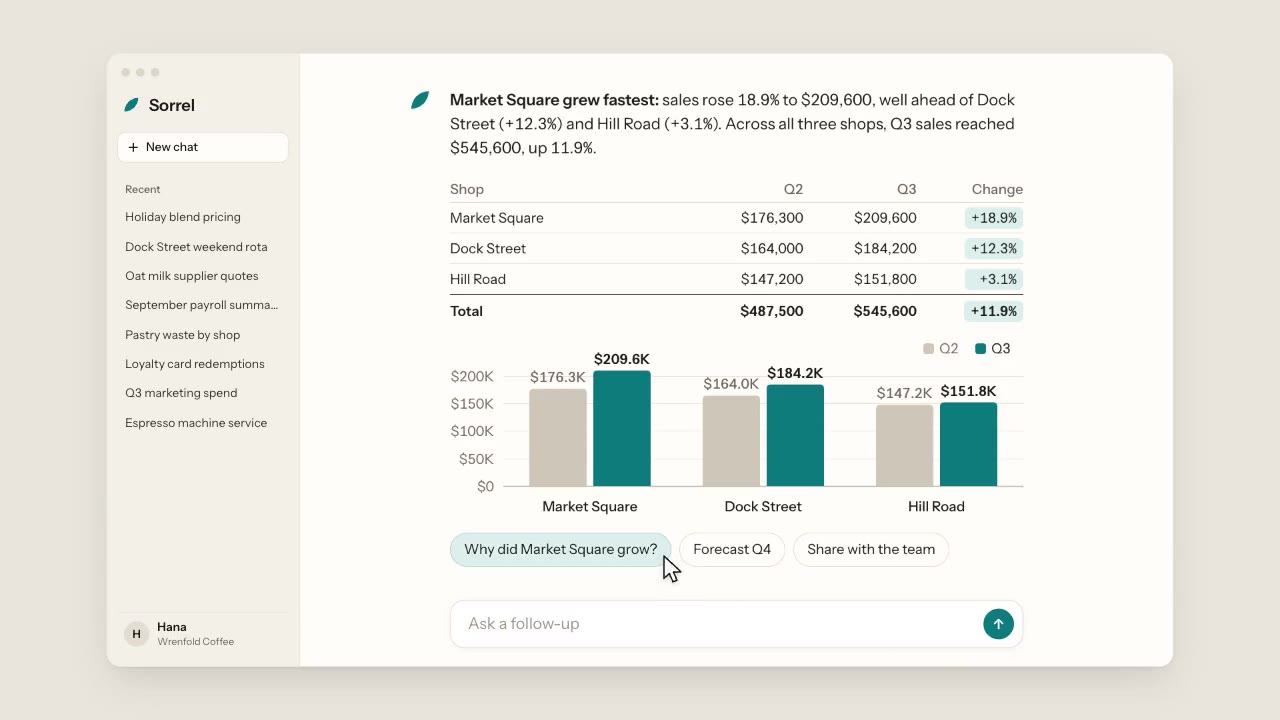
A warm, light chat app: a cursor types a question about three coffee shops, the assistant streams its answer word by wo…
More like this on the motion design inspiration board: Data visualization inspirationParticle animation inspirationDiagram animation inspiration