
Premium
Migration Chord Diagram
Eight fictional regions ring a deep ink circle: arcs grow to scale, translucent ribbons draw from each origin to a pointed arriving end, then Calder Plains comes into focus as the rest dims, every label flips to its flows in and out, and a net gain of +255k counts up.
Written and rendered by AI CSS Animations Nov 2, 2026
- Type
- prompt
- Made with
- Claude Opus 5.5 in Claude Code
- Built in
- SVG
- Topics
- Charts · Diagrams
About this style
A chord diagram places groups around a circle and joins them with ribbons whose width shows how much flows between each pair, so a whole matrix of exchanges fits in one round picture. Martin Krzywinski's Circos software made the circular layout familiar in genomics around 2009, and circular migration plots by the demographers Guy Abel and Nikola Sander later showed global movements between regions the same way. The form works when the ribbons are measured honestly, direction is visible and the reader is given one path through the tangle.
Premium
Unlock the prompt
Everything you see above is live. Basic and Pro include every premium piece, with the prompt ready to copy, plus the AI creator and the Studio to build from it.
Similar prompts
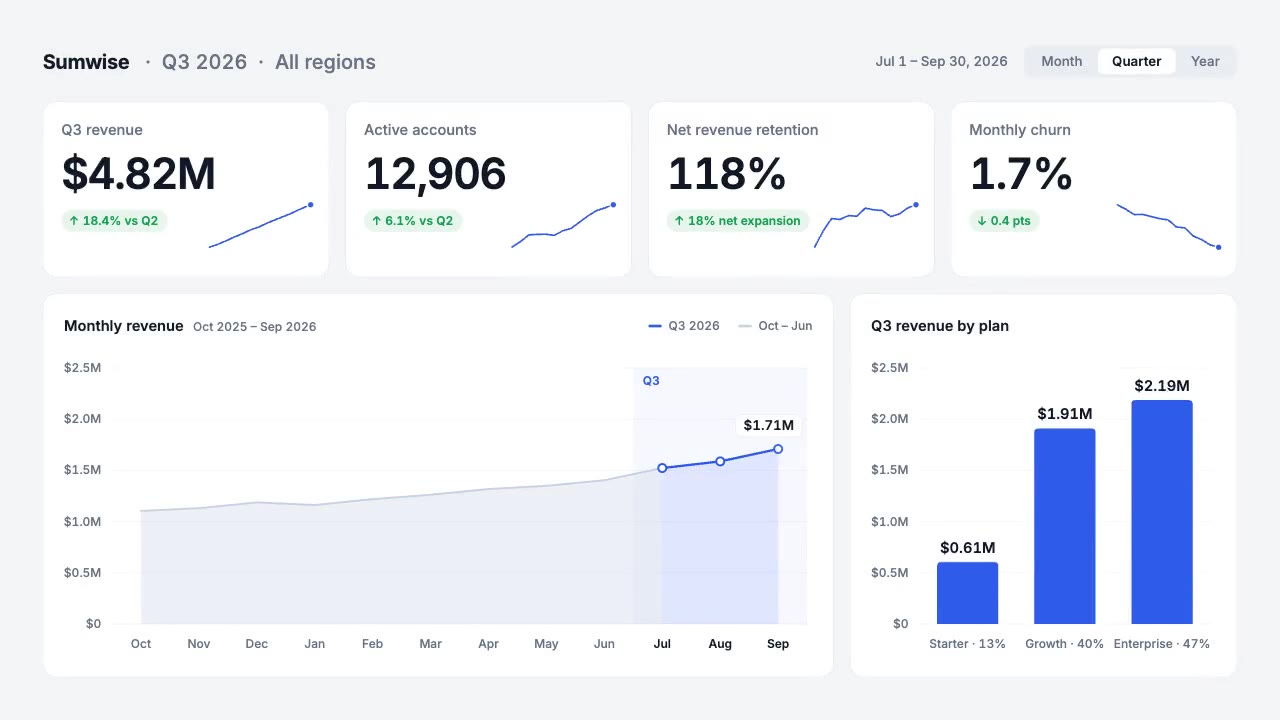
A light analytics dashboard builds itself from fictional data that adds up: counters roll on tabular figures, sparkline…
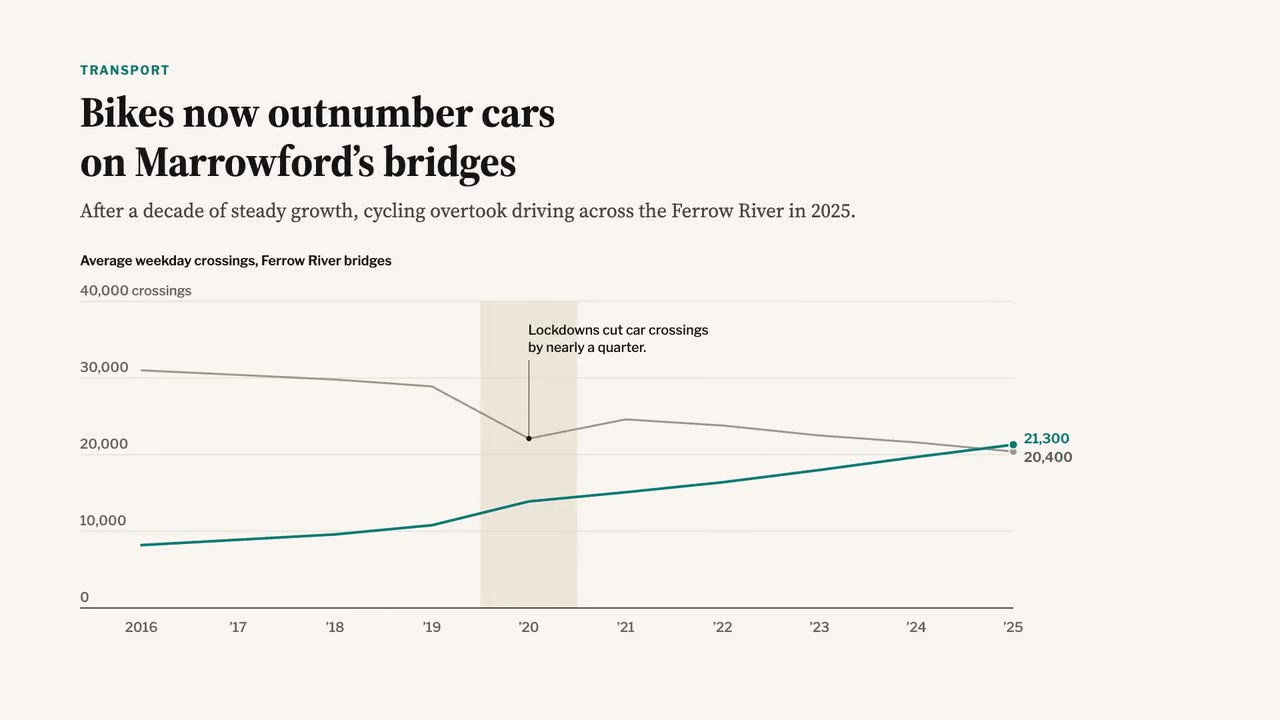
A newspaper-grade animated chart: serif headline and dek, a two-line chart that draws year by year, a shaded 2020 band,…

A crisp live-sports graphics package over a soft-focus stadium feed: score bug with running clock, layered lower third,…
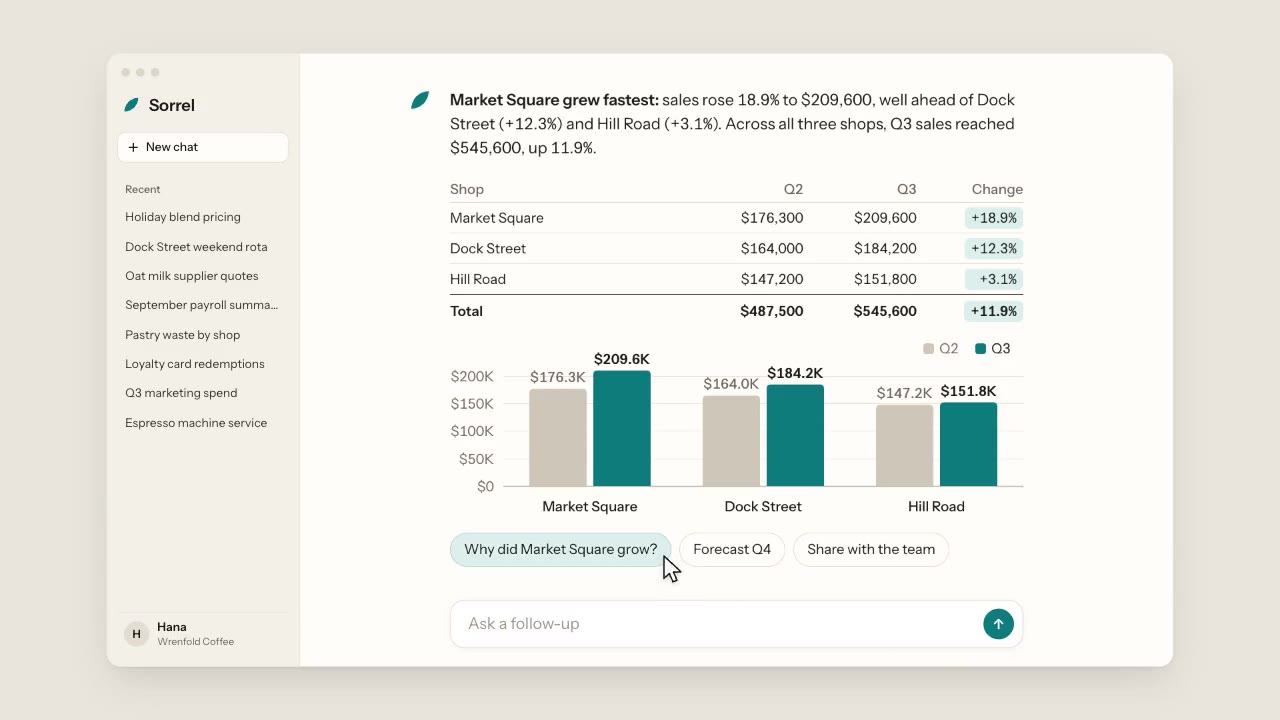
A warm, light chat app: a cursor types a question about three coffee shops, the assistant streams its answer word by wo…
More like this on the motion design inspiration board: Data visualization inspirationDiagram animation inspiration