
Speedrun Split Timer
A speedrun split timer on warm cream paper: a 40-minute run plays in time-lapse as splits land green when ahead, red on a loss and gold on best segments, a delta chart draws itself, then the clock slows to real time and the final split lands a new personal best by 0.42 seconds.
Written and rendered by AI CSS Animations Oct 19, 2026
- Type
- prompt
- Made with
- Claude Opus 5.5 in Claude Code
- Built in
- HTML/CSS
- Topics
- Product UI · Kinetic type
About this style
Speedrunners play games as fast as possible and time their runs with split timers, which divide a run into segments and compare each split against the runner's personal best. The open-source timer LiveSplit set the conventions most runners use today: green when ahead of pace, red when behind, lighter shades when the gap is shrinking or growing, and gold for a segment faster than any before. Adding up the best segments gives the sum of best, the time a perfect run would reach. Charity marathons such as Games Done Quick, held since 2010, brought these timers to large live audiences.
The prompt
Make a 10-second speedrun split timer: a whole run plays in time-lapse as splits land green when ahead, red on a loss and gold on best segments, a delta chart draws itself, then the clock slows to real time and the final split lands a new personal best.

<inputs>
If I don't give you something, use the default and don't ask.
- Game and category: Hollowbrook Climb (fictional) · Any% · Attempt #612.
- Splits, with personal-best cumulative times and this run's cumulative times: Tutorial Cave 2:41.20 / 2:38.95 · Bramble Gate 6:47.00 / 6:48.25 · Sunken Mill 11:59.35 / 11:57.35 · Belfry Ascent 18:29.45 / 18:18.75 · Owl Archive 22:28.20 / 22:20.70 · Glasswater 29:30.60 / 29:29.55 · Storm Spire 35:15.50 / 35:13.40 · Summit Bell 39:47.10 / 39:46.68.
- Deltas: −2.25 · +1.25 · −2.00 · −10.70 · −7.50 · −1.05 · −2.10 · −0.42. Belfry Ascent and Storm Spire are best-ever segments (gold).
- Sum of best: 39:22.30, becoming 39:19.35 after the two gold segments (2.60 s and 0.35 s faster).
- Banner: "NEW PERSONAL BEST" · "39:46.68 · 0.42 under 39:47.10"
- Length: 10 seconds.
</inputs>

<direction>
- Look: a split timer redesigned as an editorial layout: warm cream paper, ink type in a precise grid, tabular numerals, and the speedrunning color code (green ahead, red behind, lighter when the gap is moving the wrong way, gold for a best-ever segment) applied with discipline. The motion is a time-lapse that slows into a real-time finish, so the tension lands in the last second and a half.
- Palette: paper #F1EADB with a faint fixed dot grid (1.5px dots every 24px, #E2D8C4); ink #1C1915; secondary #776B5A; rules #D9CDB8; the active-row band #E6DCC7; ahead and gaining #136F3F; ahead but losing #3D9A63; behind but gaining #D9796A; behind and losing #B5301F; gold text #B07F0E with a shimmer highlight #F3CE5B; chart fills mint #136F3F at 12% above the zero line and red #B5301F at 12% below it. Colors are dark enough to read on cream; every colored thing means something.
- State per split, from the deltas: Tutorial Cave ahead and gaining; Bramble Gate behind and losing (the red loss); Sunken Mill ahead and gaining; Belfry Ascent gold; Owl Archive ahead but losing; Glasswater ahead but losing; Storm Spire gold; Summit Bell ahead but losing, and a new personal best.
- Type: Chivo Mono 500–700 for every time, delta and number (tabular figures); Gabarito 500–800 for names and labels. Nothing below 20px.
- Layout on the 1920 × 1080 stage:
  - header, y 80–160: "HOLLOWBROOK CLIMB" in Gabarito 800, 40px, at x 120; "Any% · Attempt #612" in Gabarito 500, 24px, secondary, beneath it; at the right, "PB 39:47.10" in Chivo Mono 500, 26px, right-aligned at x 1800, and, ending at x 1540 to its left, a playback chip (an ink-outlined pill, Chivo Mono 600, 22px) reading the time-lapse rate ("×480", "×40", "1× REAL TIME");
  - splits table, x 120–1060: eight rows at 80px pitch from y 220, separated by 1px rules; each row a 40px pictogram in ink line art (a cave arch, a gate, a water wheel, a bell tower, an owl's face, a water drop, a spire with a lightning bolt, a bell), the split name in Gabarito 600, 28px, the delta column right-aligned at x 840 in Chivo Mono 600, 26px, and the time column right-aligned at x 1060 in Chivo Mono 500, 28px, showing the PB time in secondary until the split lands and then this run's time in ink; the current row sits on the active band;
  - timer, x 1120–1800: the running time in Chivo Mono 700, 128px, right-aligned at x 1800 on baseline 360, with a "SEGMENT" line beneath (the current segment's elapsed time in 26px) and, in the last stretch, "PB MARGIN" with the seconds still in hand;
  - delta chart, x 1120–1800, y 440–760: a zero line, x positions for splits 1 to 8, y from +4 s (bottom) to −12 s (top), so ahead plots above zero; light gridlines every 4 s labeled in Chivo Mono 20px; the line and its tinted area draw one segment at a time as splits land, each point a 10px dot in its state's color (gold dots get a gold ring);
  - stats, x 1120–1800, y 790–900: "Sum of best" and "Previous segment" rows in Gabarito 500, 24px, with values in Chivo Mono 600, 26px, right-aligned.
- The run clock: run time r(t) is a monotone cubic through the knots (0.6 s, 0), (1.20, 158.95), (1.85, 408.25), (2.50, 717.35), (3.15, 1098.75), (3.80, 1340.70), (4.45, 1769.55), (5.10, 2113.40), (6.60, 2385.28) in run seconds, then exactly real time (r = 2385.28 + (t − 6.6)) until 8.00 s, when it stops at 2386.68 (39:46.68). So splits 1–7 land at those knot times, the clock decelerates through the final segment, and the last 1.4 s count every hundredth. The playback chip shows the current rate rounded to the nearest ten and reads "1× REAL TIME" from 6.6 s.
- A split landing: the row's time rolls from the PB value to this run's value digit by digit like an odometer (0.2 s, easeOutCubic); its delta chip slides in 16px from the right as it fades in (0.18 s) in its state's color; the active band slides down to the next row (80px in 0.22 s on cubic-bezier(0.3, 0, 0.2, 1)); the chart adds its point and segment; the "Previous segment" stat updates. The red loss nudges its row 4px down and back once. A gold split also sends a soft 120px gold band sweeping across its row once in 0.5 s, rings its chart dot, and rolls the sum of best down (39:22.30 to 39:19.70 at Belfry Ascent, then to 39:19.35 at Storm Spire).
- The finish: from 6.6 s, "PB MARGIN" counts down from 1.82 to 0.42 beside a 300px bar that drains toward a gold tick; the margin turns from #136F3F to #3D9A63 when it drops below 1.00. At 8.00 s the last split lands: the clock stops and its digits turn gold, a shimmer sweeps across them once (0.6 s), the row's delta shows −0.42 with a small gold "PB" tag, the chart's last point lands just above zero, "NEW PERSONAL BEST" drops in as a gold-ruled label above the timer (Gabarito 800, 30px, tracked 0.1em, gold, over the line in Chivo Mono 500, 22px, secondary), and the header's "PB 39:47.10" strikes through and gives way to "PB 39:46.68".
- Motion feel: precise and quick; nothing bounces except the odometer's settle and a 3% overshoot on the banner; the time-lapse digits roll smoothly, and centiseconds are never rendered as a flicker of more than one change per frame.
- Premium: a strict grid with tabular figures, the color code applied exactly, numbers that add up from row to chart to stats, pacing that saves the drama for a real-time final second. Cheap: a neon timer on black, confetti, colors used for decoration, times that don't add up, a timer that just jumps to the end.
- Banned: confetti, emoji, real game, timer software or event names and logos in the video, dark backgrounds, glow, gradients beyond the shimmer and the chart tints, anything flashing more than 3 times per second.
</direction>

<structure>
- 0.0–0.6s: the layout builds: header and rules draw left to right, the split names and PB times rise in 40 ms apart, the timer reads 0:00.00, the chart's axes draw.
- 0.6–2.6s: the time-lapse run: the clock races; Tutorial Cave lands at 1.20 s (−2.25, dark green), Bramble Gate at 1.85 s (+1.25, dark red, the nudge), Sunken Mill at 2.50 s (−2.00, dark green); the chart dips below zero and climbs back.
- 2.6–5.2s: Belfry Ascent at 3.15 s (−10.70, gold, the sweep, sum of best to 39:19.70), Owl Archive at 3.80 s (−7.50, light green), Glasswater at 4.45 s (−1.05, light green), Storm Spire at 5.10 s (−2.10, gold, sum of best to 39:19.35).
- 5.2–6.6s: the final segment: the clock decelerates and the chip steps down to 1×; Summit Bell's row is active; the timer column eases in 4% toward the viewer. The 6.0 s frame is complete: seven splits landed with their colors, the chart drawn to split 7, the timer slowing as it nears 39:45, every stat in place.
- 6.6–8.0s: real time: hundredths tick, "PB MARGIN" drains from 1.82 toward 0.42, the bar shrinking toward its gold tick.
- 8.0–8.8s: the split: the clock stops gold at 39:46.68 with its shimmer, −0.42 and the PB tag land, the chart's final point lands just above zero, the banner drops in and the header's PB updates.
- 8.8–10.0s: hold.
For other lengths, move the split knots evenly and keep the last 1.4 s in real time and at least 1 s of hold.
</structure>

<build>
- One self-contained index.html (inline CSS and JS), a 1920×1080 (16:9) stage scaled to fit the window, designed for 60fps. No image, video, texture or model files: every shape and texture is generated in code.
- window.seek(t), t in seconds, computes every visual from t alone: no CSS transitions or CSS animations, no setTimeout/setInterval, no state carried between frames, randomness only from a seeded PRNG. Anything cumulative is solved analytically from t or precomputed once at load at a fixed step. Past the end, seek clamps to the last frame.
- Without ?render in the URL, drive seek from requestAnimationFrame so it plays in a browser (loop after a 1s end hold); with ?render, don't start that loop.
- Google Fonts via <link> are fine; await document.fonts.load() for each face before defining window.seek.
- Engine: HTML/CSS: absolutely positioned elements whose transforms, opacity and text are set from seek, with inline SVG for the pictograms, the chart and the margin bar; no canvas and no libraries.
- The run clock is the monotone cubic above evaluated at t (precompute its slopes once at load); every displayed time, delta, segment time, margin and chart point derives from r(t) and the split table; odometer rolls, slides and sweeps are closed-form functions of the time since each split. Draw the dot grid once with a CSS background.
</build>

<check>
Before showing me, step through one frame per second (t = 0…10): screenshot each and look at it. Fix overlaps, clipped or cramped text, and anything off-style or Banned. Check every row's time, delta and color match the inputs (dark green, dark red, dark green, gold, light green, light green, gold, light green), each split lands at its knot time and the clock reads exactly that split's time then, the chart's points match the deltas on the axis, the sum of best reads 39:22.30, then 39:19.70, then 39:19.35, the chip reads 1× REAL TIME from 6.6 s and the last 1.4 s count true hundredths, the margin ends at 0.42, the 6.0 s frame is complete, the final frame shows the gold clock at 39:46.68 with the banner, and all colored text reads clearly on the cream. Confirm seek(10) and seek(11) match, so the final frame holds.
</check>
Ours, and free to use under CC0: copy it, change it, ship it. No credit needed.
Similar prompts

A slow, ribbon-like gradient mesh flows in a skewed band behind sharp headline type, while white payment, API and chart…
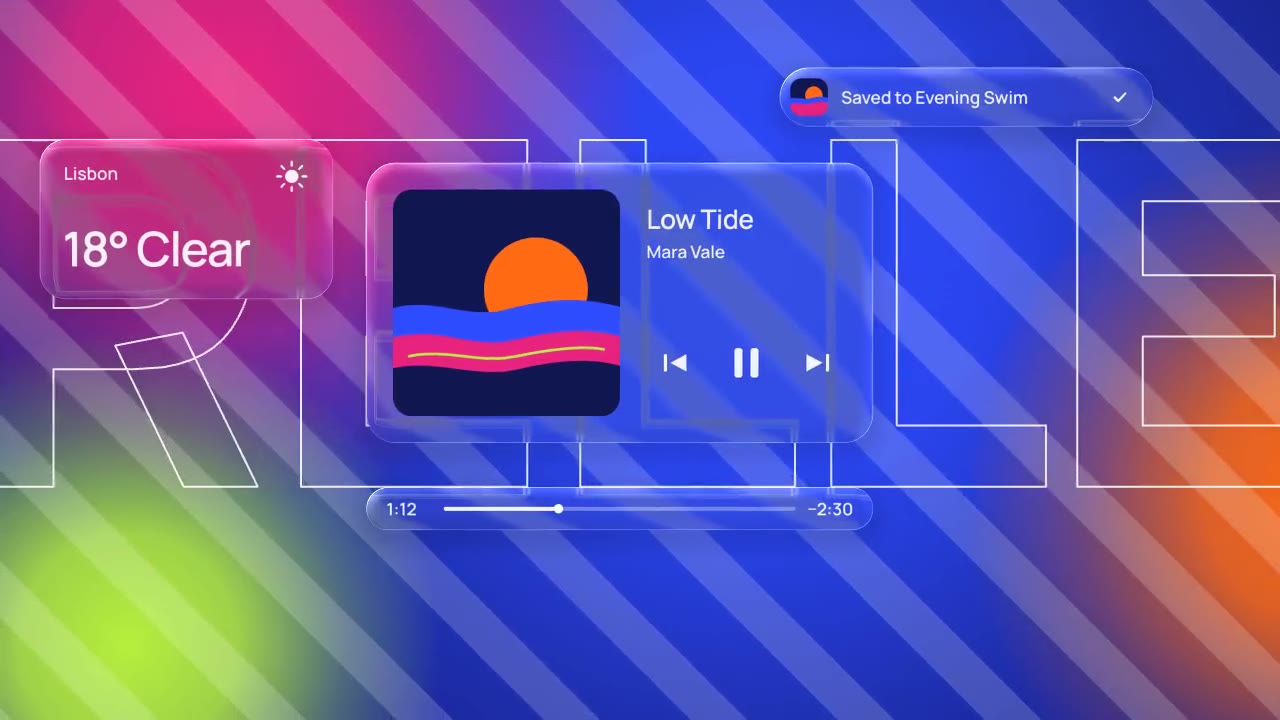
Glass panels with real refraction float over vivid, striped color: their rims bend what's behind them, two buttons fuse…
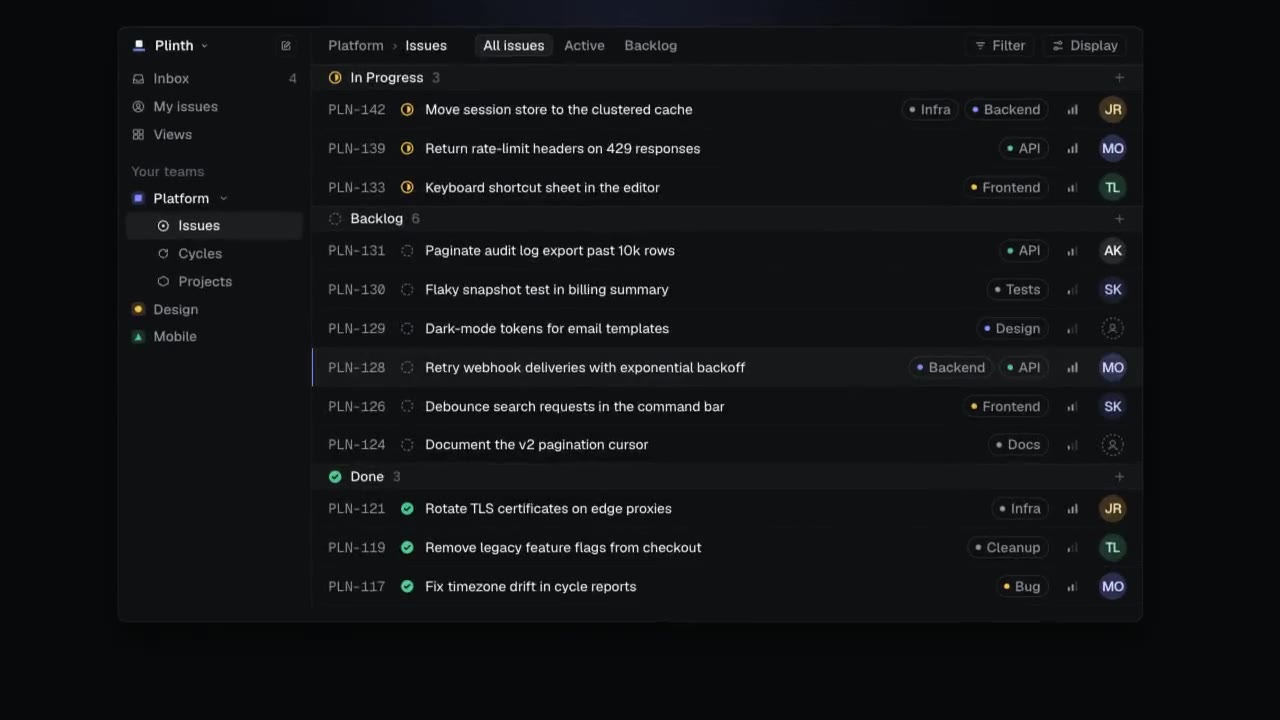
A dark-mode work tool drawn in hairlines and quiet radial glows: issue rows populate, ⌘K opens a command menu, a comman…
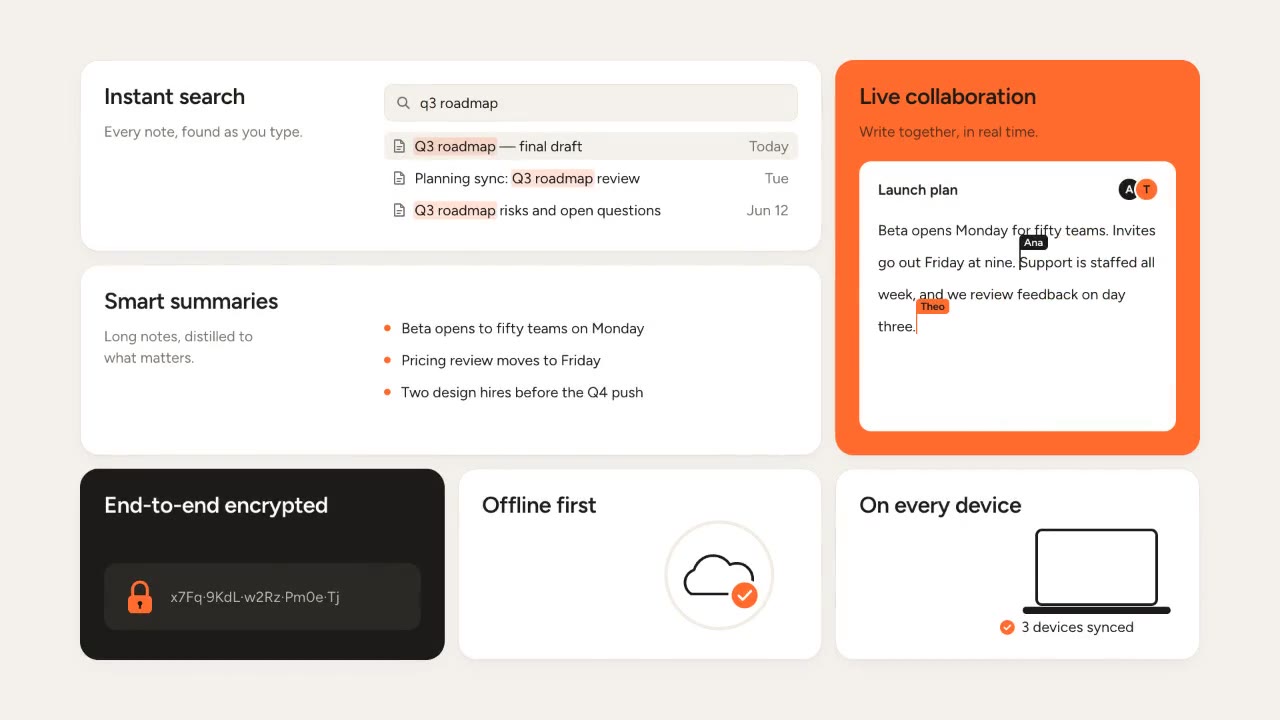
Rounded tiles spring into a bento grid on warm paper, each acting out one feature in a small animation, then the tiles…
More like this on the motion design inspiration board: Kinetic typography inspirationUI animation inspiration